North-Central Climate Division Reservoirs: Monitored Water Supply Reservoirs are 91.9% full on 2026-04-01
Historical Data
| Date | Percent Full |
Reservoir Storage (acre-ft) |
Conservation Storage (acre-ft) |
Conservation Capacity (acre-ft) |
|
|---|---|---|---|---|---|
| Today | 2026-04-01 | 91.9 | 11,455,932 | 10,093,377 | 10,983,823 |
| Yesterday | 2026-03-31 | 91.9 | 11,457,850 | 10,095,625 | 10,983,823 |
| 2 days ago | 2026-03-30 | 92.0 | 11,464,395 | 10,102,333 | 10,983,823 |
| 1 week ago | 2026-03-25 | 92.2 | 11,499,850 | 10,131,573 | 10,983,823 |
| 1 month ago | 2026-03-01 | 91.9 | 11,470,302 | 10,095,149 | 10,983,823 |
| 3 months ago | 2026-01-01 | 91.4 | 11,401,731 | 10,036,597 | 10,983,823 |
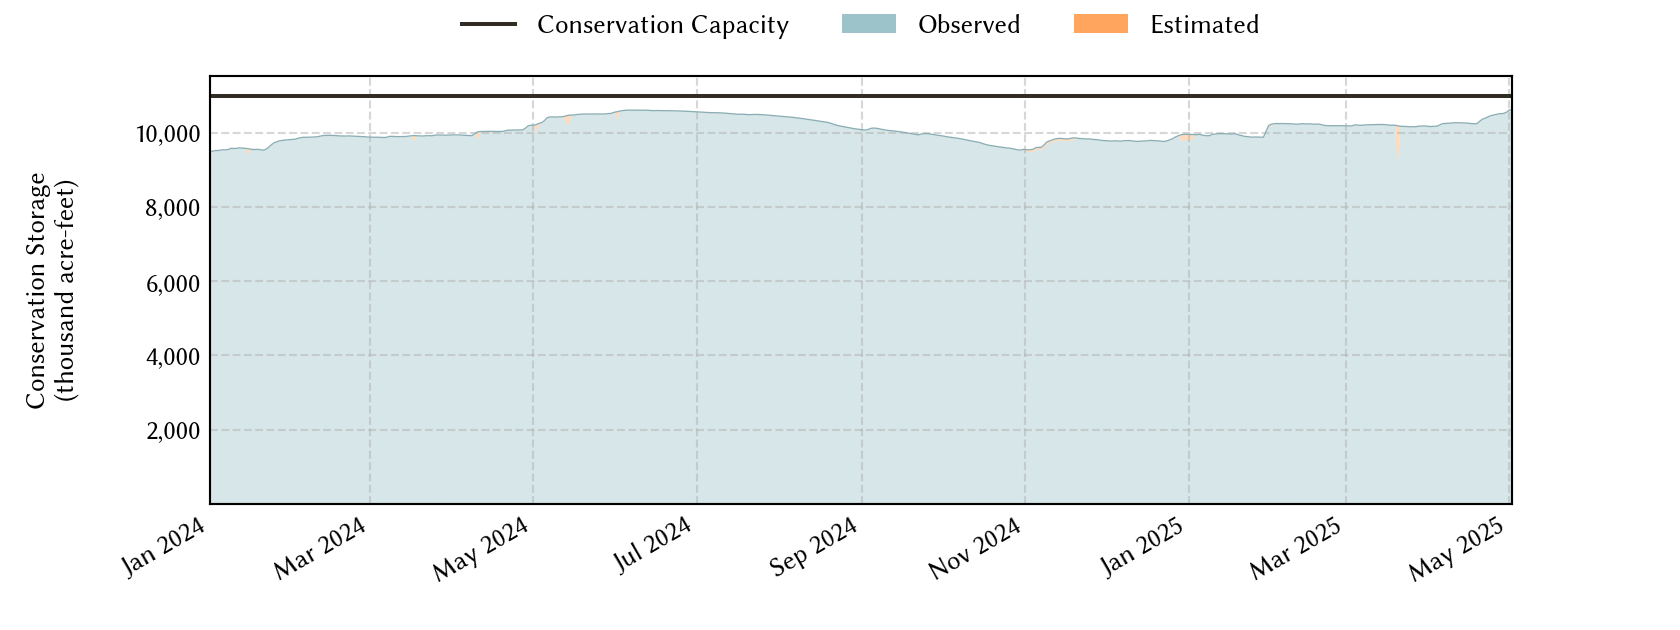
| 6 months ago | 2025-10-01 | 93.6 | 11,637,257 | 10,276,499 | 10,983,823 |
| 1 year ago | 2025-04-01 | 92.5 | 11,478,194 | 10,161,811 | 10,983,823 |
*
Percent Full is based on Conservation Storage and Conservation Capacity and doesn't account for storage in flood pool.
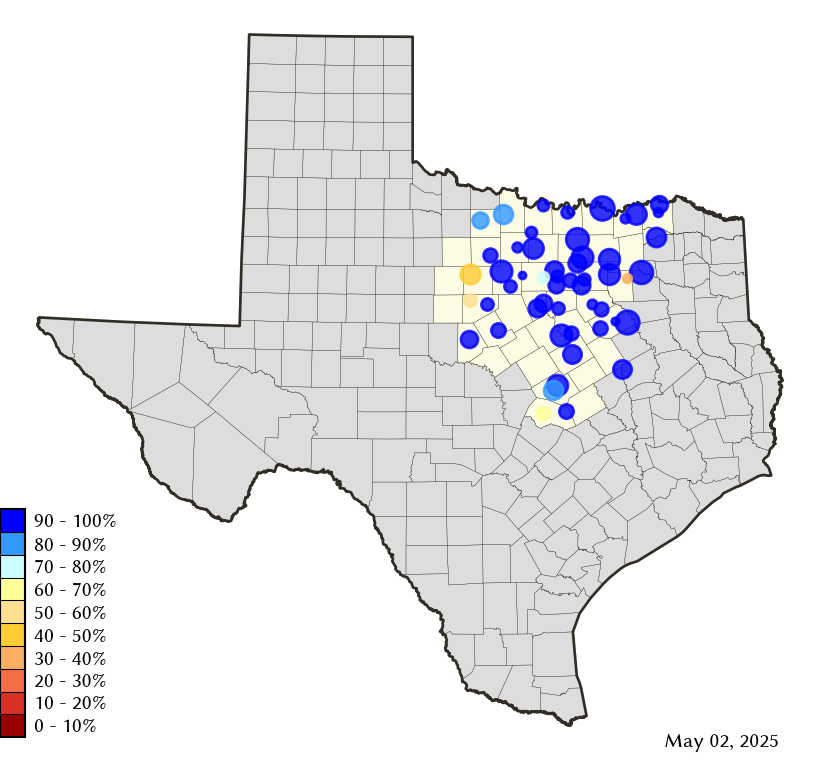
Area Map
Reservoir Storage
| Reservoir | Type | Percent Full |
Water Level (ft) |
Height Above Conservation Pool (ft) |
Reservoir Storage (acre-ft) |
Conservation Storage (acre-ft) |
Conservation Capacity (acre-ft) |
Surface Area (acres) |
|---|---|---|---|---|---|---|---|---|
| Amon G Carter |

|
84.9 | 917.93 | -2.07 | 17,147 | 16,363 | 19,266 | 1,334 |
| Aquilla |

|
92.0 | 536.36 | -1.14 | 39,838 | 39,802 | 43,243 | 2,948 |
| Arlington |
|
94.2 | 548.77 | -1.23 | 37,843 | 37,811 | 40,157 | 1,892 |
| Arrowhead |
|
80.5 | 922.71 | -3.29 | 185,426 | 185,426 | 230,359 | 12,809 |
| Bardwell |
|
100.0 | 421.34 | 0.34 | 45,047 | 43,856 | 43,856 | 3,338 |
| Belton |
|
96.5 | 592.76 | -1.24 | 417,402 | 417,402 | 432,631 | 12,119 |
| Benbrook |
|
82.5 | 689.67 | -4.33 | 70,700 | 70,700 | 85,648 | 3,239 |
| Bois d'Arc |
|
88.3 | 531.34 | -2.66 | 324,610 | 324,610 | 367,609 | 15,352 |
| Bonham |
|
74.9 | 562.20 | -2.80 | 8,274 | 8,262 | 11,027 | 916 |
| Bridgeport |
|
85.0 | 831.24 | -4.76 | 316,336 | 316,336 | 372,183 | 11,219 |
| Brownwood |
|
81.9 | 1,421.21 | -3.39 | 107,182 | 107,182 | 130,868 | 6,034 |
| Cisco |
|
47.2 | 1,505.36 | -17.10 | 13,701 | 13,701 | 29,003 | 632 |
| Comanche Creek |
|
99.9 | 774.96 | -0.04 | 151,146 | 151,123 | 151,250 | 3,165 |
| Crook |
|
96.3 | 475.67 | -0.33 | 8,866 | 8,851 | 9,195 | 1,039 |
| Eagle Mountain |
|
82.5 | 645.36 | -3.74 | 152,683 | 152,683 | 185,087 | 8,150 |
| Georgetown |
|
75.8 | 783.37 | -7.63 | 28,871 | 28,808 | 38,005 | 1,106 |
| Graham |
|
75.6 | 1,070.21 | -4.79 | 34,257 | 34,243 | 45,288 | 2,112 |
| Granbury |
|
97.9 | 692.36 | -0.34 | 131,101 | 130,192 | 132,949 | 8,048 |
| Granger |
|
100.0 | 504.09 | 0.09 | 52,193 | 51,822 | 51,822 | - n.a. - |
| Grapevine |
|
100.0 | 535.09 | 0.09 | 163,658 | 163,064 | 163,064 | - n.a. - |
| Halbert |
|
75.1 | 365.25 | -2.75 | 4,532 | 4,532 | 6,033 | 514 |
| Hubbard Creek |
|
41.3 | 1,168.08 | -15.23 | 134,282 | 129,406 | 313,298 | 8,725 |
| Hubert H Moss |
|
89.4 | 712.58 | -2.42 | 21,613 | 21,516 | 24,058 | 1,021 |
| Jim Chapman |
|
75.2 | 436.21 | -3.79 | 230,417 | 194,642 | 258,723 | 15,806 |
| Joe Pool |
|
100.0 | 522.17 | 0.17 | 152,140 | 149,629 | 149,629 | 6,738 |
| Kickapoo |
|
82.6 | 1,042.30 | -2.70 | 71,341 | 71,341 | 86,345 | 5,250 |
| Lavon |
|
97.9 | 491.59 | -0.41 | 404,182 | 401,341 | 409,757 | 20,436 |
| Leon |
|
80.8 | 1,371.73 | -3.27 | 22,724 | 22,444 | 27,762 | 1,499 |
| Lewisville |
|
99.6 | 521.91 | -0.09 | 596,473 | 560,799 | 563,228 | 26,976 |
| Limestone |
|
83.7 | 360.21 | -2.79 | 170,630 | 170,630 | 203,780 | 11,261 |
| Lost Creek |
|
93.3 | 1,007.47 | -2.03 | 11,144 | 11,144 | 11,950 | - n.a. - |
| Mineral Wells |
|
93.8 | 862.29 | -0.71 | 4,948 | 4,948 | 5,273 | 450 |
| Mountain Creek |
|
100.0 | 457.82 | 0.82 | 25,121 | 22,850 | 22,850 | 2,950 |
| Navarro Mills |
|
95.1 | 423.98 | -0.52 | 47,408 | 47,407 | 49,827 | 4,600 |
| New Terrell City |
|
26.8 | 494.00 | -10.00 | 2,307 | 2,296 | 8,583 | 378 |
| Nocona |
|
84.4 | 824.91 | -2.59 | 18,397 | 18,093 | 21,444 | 1,247 |
| Palo Pinto |
|
93.3 | 866.17 | -0.83 | 25,361 | 24,975 | 26,766 | 2,141 |
| Pat Cleburne |
|
95.4 | 732.73 | -0.77 | 24,812 | 24,812 | 26,008 | 1,542 |
| Pat Mayse |
|
88.2 | 448.56 | -2.44 | 104,482 | 100,322 | 113,683 | 5,274 |
| Possum Kingdom |
|
90.3 | 995.97 | -3.03 | 485,977 | 485,977 | 538,139 | 16,490 |
| Proctor |
|
75.0 | 1,158.85 | -3.15 | 41,088 | 41,088 | 54,762 | 3,977 |
| Ray Hubbard |
|
99.3 | 435.35 | -0.15 | 436,432 | 436,432 | 439,559 | 20,763 |
| Ray Roberts |
|
99.9 | 632.48 | -0.02 | 787,923 | 787,600 | 788,167 | 28,578 |
| Richland-Chambers |
|
92.8 | 313.16 | -1.84 | 1,045,825 | 1,020,042 | 1,099,417 | 42,403 |
| Stillhouse Hollow |
|
92.8 | 619.34 | -2.66 | 213,269 | 213,183 | 229,796 | 6,068 |
| Tawakoni |
|
96.1 | 436.57 | -0.93 | 837,766 | 837,758 | 871,685 | 36,010 |
| Texoma 1 |
|
99.0 | 616.68 | -0.32 | 2,463,771 | 1,231,885 | 1,243,801 | 74,868 |
| Waco |
|
97.3 | 461.62 | -0.60 | 184,085 | 183,859 | 188,891 | 8,334 |
| Waxahachie |
|
84.9 | 528.86 | -2.64 | 9,974 | 9,392 | 11,060 | 602 |
| Weatherford |
|
65.9 | 889.87 | -6.13 | 11,745 | 11,745 | 17,812 | 908 |
| Whitney |
|
93.9 | 531.48 | -1.52 | 531,931 | 530,577 | 564,808 | 21,825 |
| Worth |
|
75.7 | 592.21 | -1.79 | 27,551 | 18,475 | 24,419 | 3,213 |
footnotes
1
Lake Texoma straddles the border of Texas and Oklahoma, Texas has rights to 50% of Lake Texoma's total conservation capacity. Percent full, conservation storage and conservation capacity are based on the Texas share.