Midland Odessa Area Reservoirs: Monitored Water Supply Reservoirs are 28.6% full on 2026-04-01
Historical Data
| Date | Percent Full |
Reservoir Storage (acre-ft) |
Conservation Storage (acre-ft) |
Conservation Capacity (acre-ft) |
|
|---|---|---|---|---|---|
| Today | 2026-04-01 | 28.6 | 364,933 | 364,260 | 1,271,543 |
| Yesterday | 2026-03-31 | 28.7 | 365,341 | 364,668 | 1,271,543 |
| 2 days ago | 2026-03-30 | 28.7 | 365,600 | 364,927 | 1,271,543 |
| 1 week ago | 2026-03-25 | 28.8 | 367,221 | 366,548 | 1,271,543 |
| 1 month ago | 2026-03-01 | 29.3 | 373,248 | 372,575 | 1,271,543 |
| 3 months ago | 2026-01-01 | 30.4 | 387,592 | 386,919 | 1,271,543 |
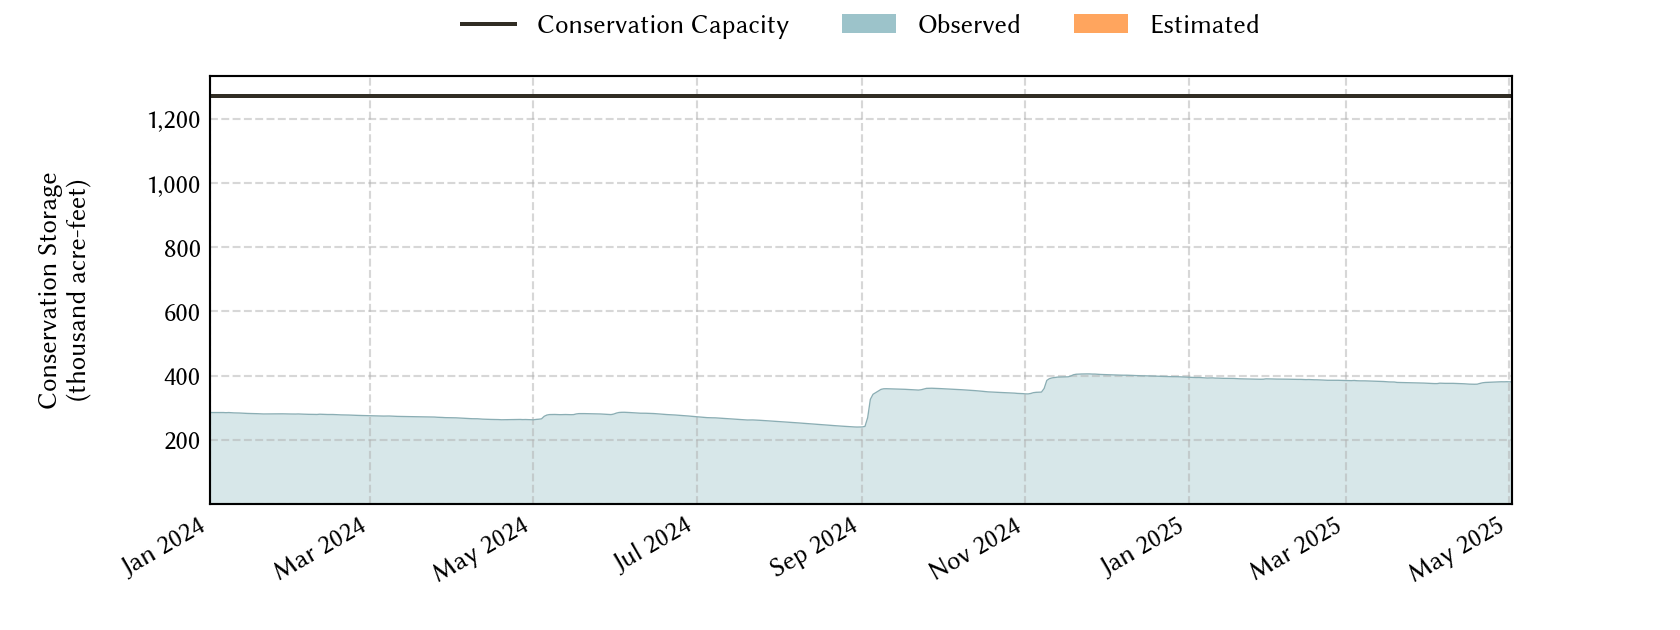
| 6 months ago | 2025-10-01 | 32.5 | 414,321 | 413,648 | 1,271,543 |
| 1 year ago | 2025-04-01 | 29.6 | 376,530 | 375,857 | 1,271,543 |
*
Percent Full is based on Conservation Storage and Conservation Capacity and doesn't account for storage in flood pool.
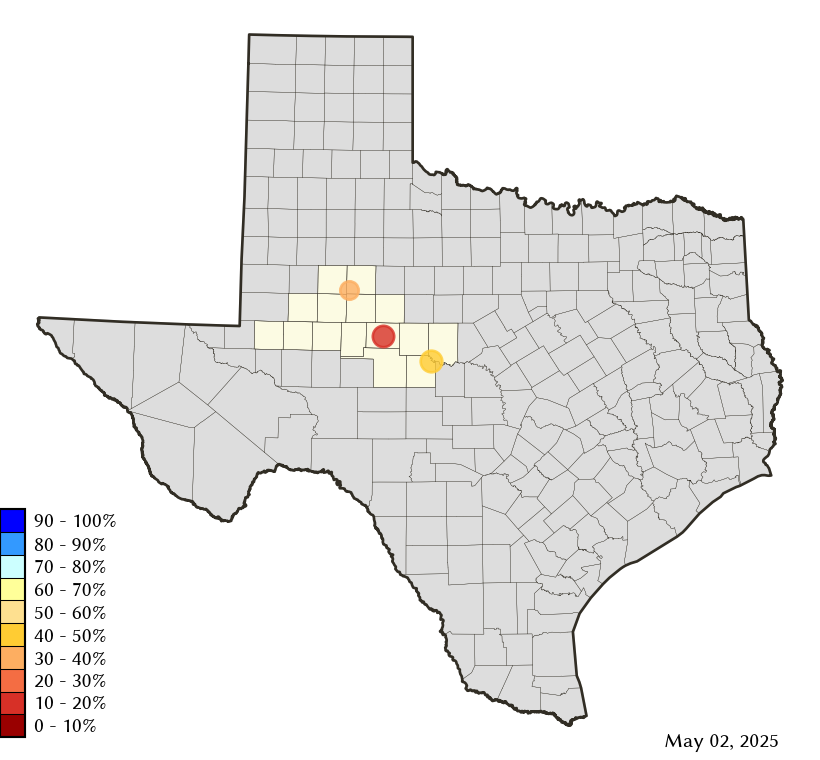
Area Map
Reservoir Storage
| Reservoir | Type | Percent Full |
Water Level (ft) |
Height Above Conservation Pool (ft) |
Reservoir Storage (acre-ft) |
Conservation Storage (acre-ft) |
Conservation Capacity (acre-ft) |
Surface Area (acres) |
|---|---|---|---|---|---|---|---|---|
| E V Spence |

|
11.6 | 1,845.43 | -52.57 | 59,790 | 59,790 | 517,272 | 3,794 |
| J B Thomas |
|
27.4 | 2,230.52 | -27.48 | 55,412 | 54,739 | 199,931 | 3,555 |
| O H Ivie |
|
45.1 | 1,531.19 | -20.31 | 249,731 | 249,731 | 554,340 | - n.a. - |