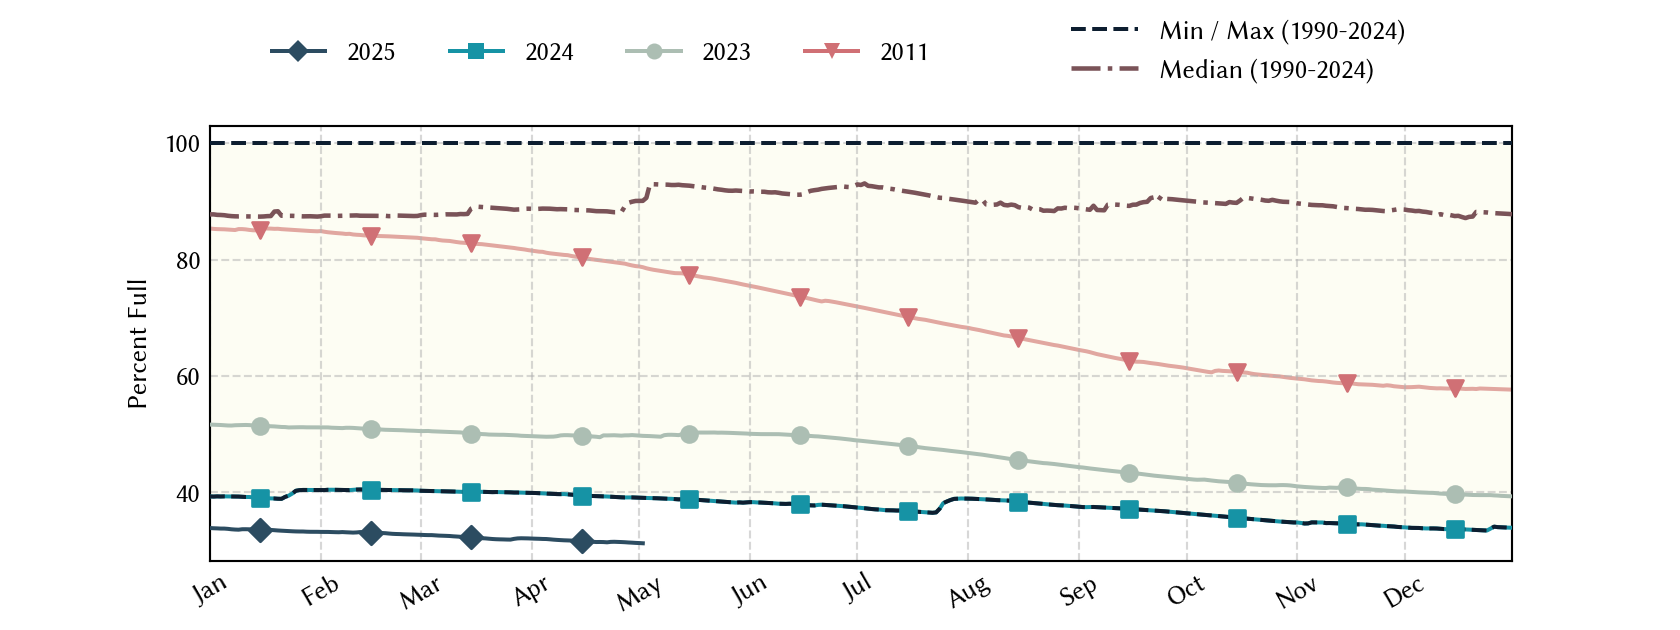
South-Central-Texas Planning Region Reservoirs: Monitored Water Supply Reservoirs are 38.6% full on 2026-04-01
Historical Data
| Date | Percent Full |
Reservoir Storage (acre-ft) |
Conservation Storage (acre-ft) |
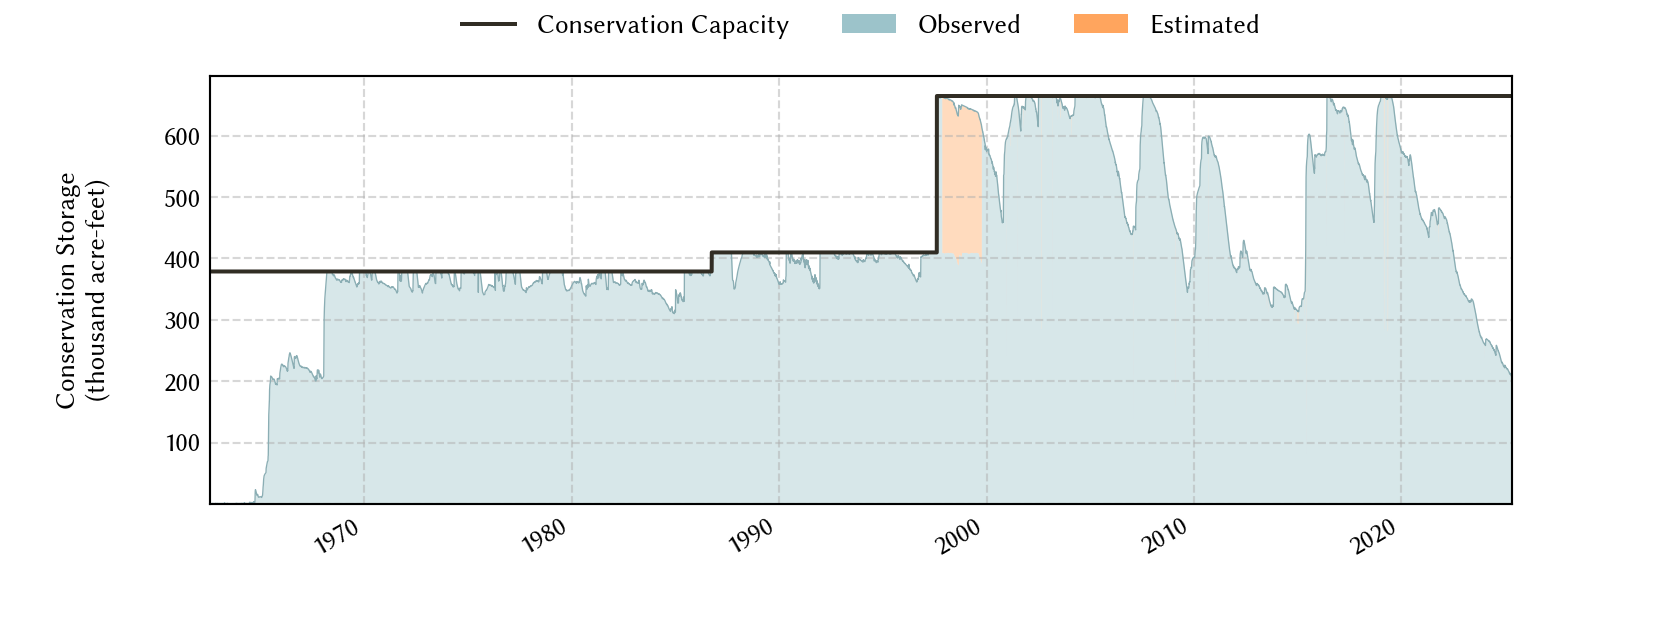
Conservation Capacity (acre-ft) |
|
|---|---|---|---|---|---|
| Today | 2026-04-01 | 38.6 | 256,882 | 256,811 | 664,644 |
| Yesterday | 2026-03-31 | 38.7 | 257,021 | 256,950 | 664,644 |
| 2 days ago | 2026-03-30 | 38.7 | 257,238 | 257,167 | 664,644 |
| 1 week ago | 2026-03-25 | 38.9 | 258,361 | 258,290 | 664,644 |
| 1 month ago | 2026-03-01 | 39.5 | 262,345 | 262,274 | 664,644 |
| 3 months ago | 2026-01-01 | 40.6 | 269,965 | 269,894 | 664,644 |
| 6 months ago | 2025-10-01 | 44.0 | 292,816 | 292,745 | 664,644 |
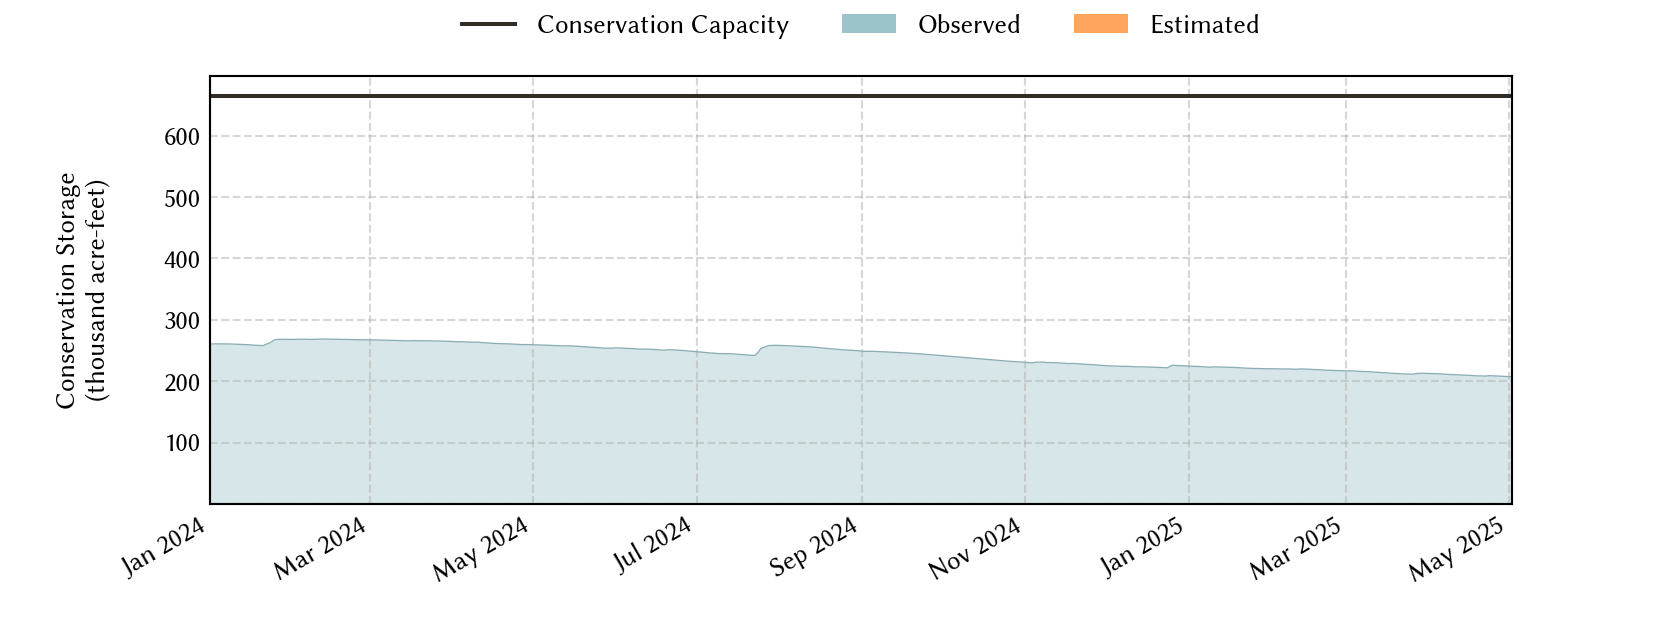
| 1 year ago | 2025-04-01 | 32.0 | 212,689 | 212,618 | 664,644 |
*
Percent Full is based on Conservation Storage and Conservation Capacity and doesn't account for storage in flood pool.
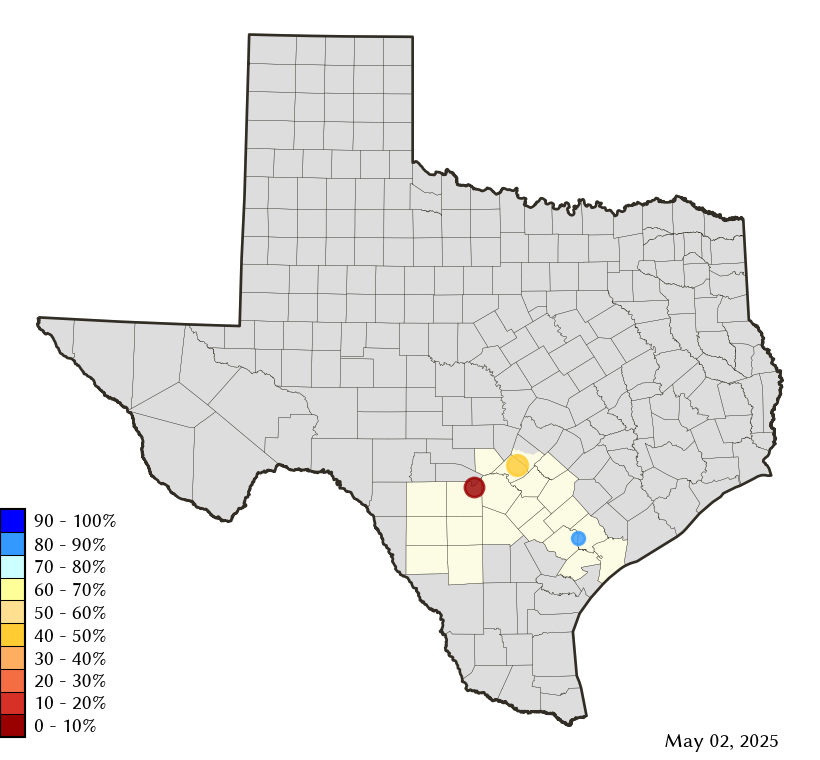
Area Map
Reservoir Storage
| Reservoir | Type | Percent Full |
Water Level (ft) |
Height Above Conservation Pool (ft) |
Reservoir Storage (acre-ft) |
Conservation Storage (acre-ft) |
Conservation Capacity (acre-ft) |
Surface Area (acres) |
|---|---|---|---|---|---|---|---|---|
| Canyon |

|
59.0 | 886.75 | -22.25 | 223,422 | 223,351 | 378,781 | 5,822 |
| Coleto Creek |

|
75.4 | 94.75 | -3.25 | 23,416 | 23,416 | 31,040 | 2,194 |
| Medina |
|
3.9 | 977.06 | -87.14 | 10,044 | 10,044 | 254,823 | 729 |