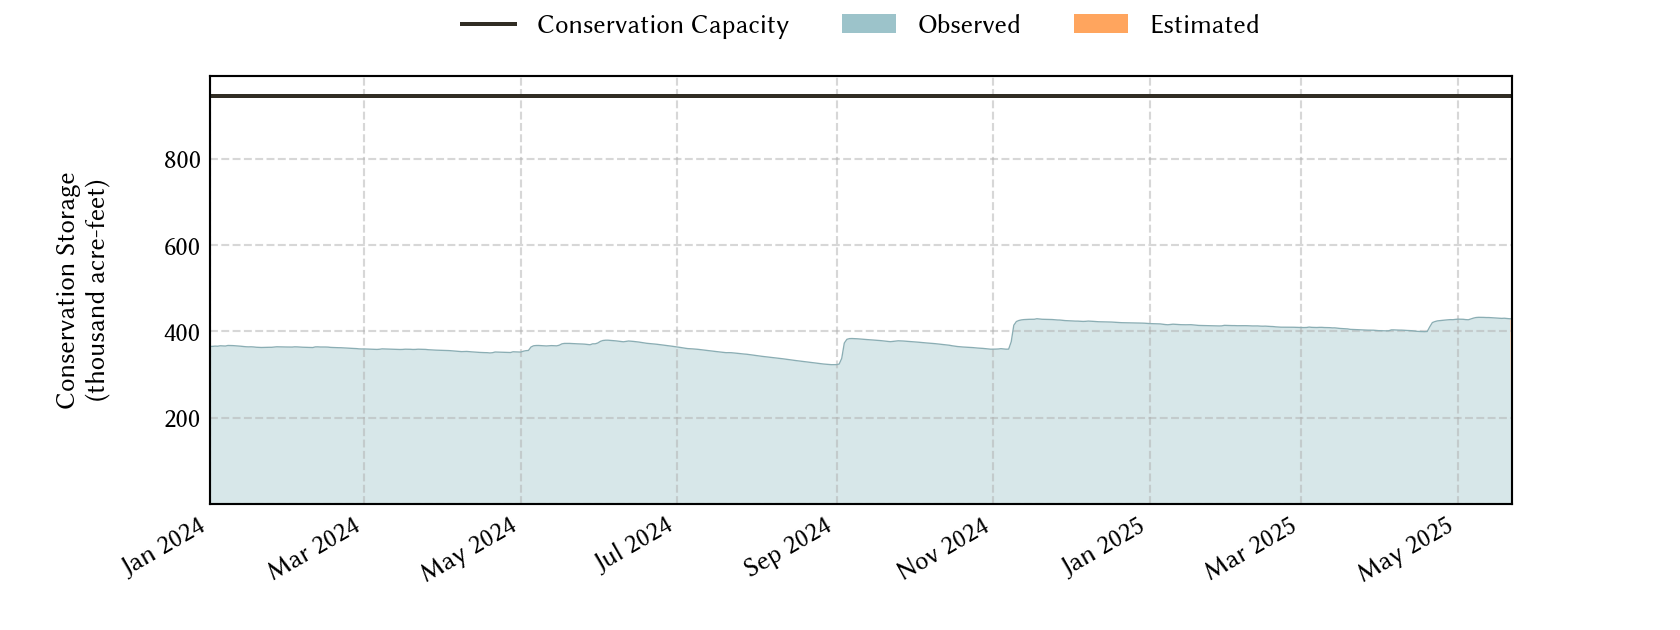
Abilene Area Reservoirs: Monitored Water Supply Reservoirs are 45.4% full on 2026-04-01
Historical Data
| Date | Percent Full |
Reservoir Storage (acre-ft) |
Conservation Storage (acre-ft) |
Conservation Capacity (acre-ft) |
|
|---|---|---|---|---|---|
| Today | 2026-04-01 | 45.4 | 434,322 | 429,440 | 945,568 |
| Yesterday | 2026-03-31 | 45.5 | 434,663 | 429,781 | 945,568 |
| 2 days ago | 2026-03-30 | 45.5 | 435,012 | 430,130 | 945,568 |
| 1 week ago | 2026-03-25 | 45.7 | 436,719 | 431,837 | 945,568 |
| 1 month ago | 2026-03-01 | 46.1 | 440,501 | 435,619 | 945,568 |
| 3 months ago | 2026-01-01 | 47.7 | 455,920 | 451,038 | 945,568 |
| 6 months ago | 2025-10-01 | 50.6 | 483,426 | 478,544 | 945,568 |
| 1 year ago | 2025-04-01 | 42.5 | 406,438 | 401,556 | 945,568 |
*
Percent Full is based on Conservation Storage and Conservation Capacity and doesn't account for storage in flood pool.
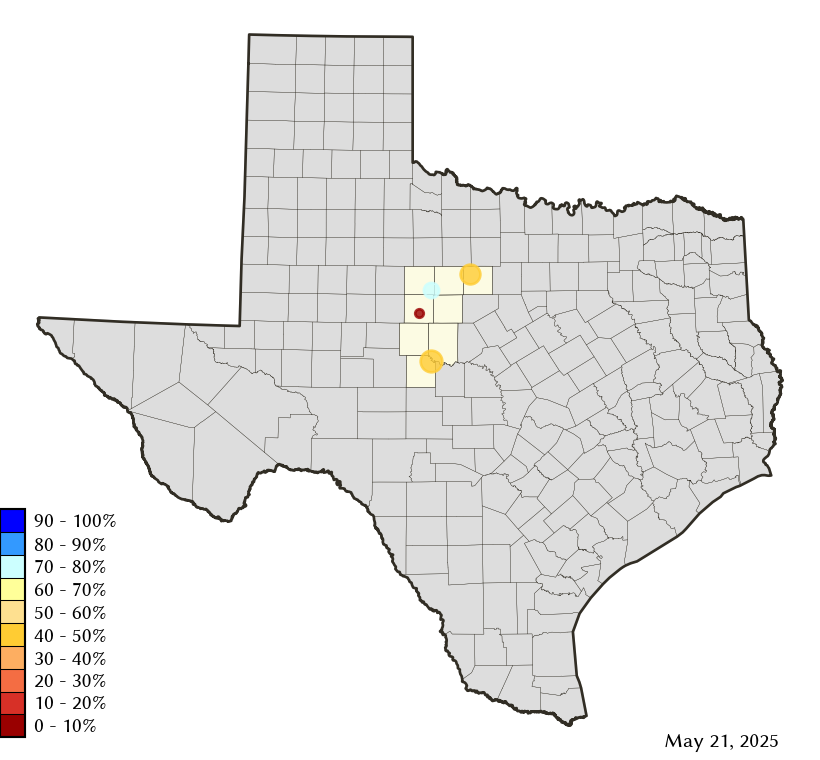
Area Map
Reservoir Storage
| Reservoir | Type | Percent Full |
Water Level (ft) |
Height Above Conservation Pool (ft) |
Reservoir Storage (acre-ft) |
Conservation Storage (acre-ft) |
Conservation Capacity (acre-ft) |
Surface Area (acres) |
|---|---|---|---|---|---|---|---|---|
| Abilene |

|
3.6 | 1,988.44 | -23.86 | 285 | 285 | 7,900 | 91 |
| Fort Phantom Hill |
|
71.4 | 1,630.15 | -5.75 | 50,024 | 50,018 | 70,030 | 3,090 |
| Hubbard Creek |
|
41.3 | 1,168.08 | -15.23 | 134,282 | 129,406 | 313,298 | 8,725 |
| O H Ivie |
|
45.1 | 1,531.19 | -20.31 | 249,731 | 249,731 | 554,340 | - n.a. - |