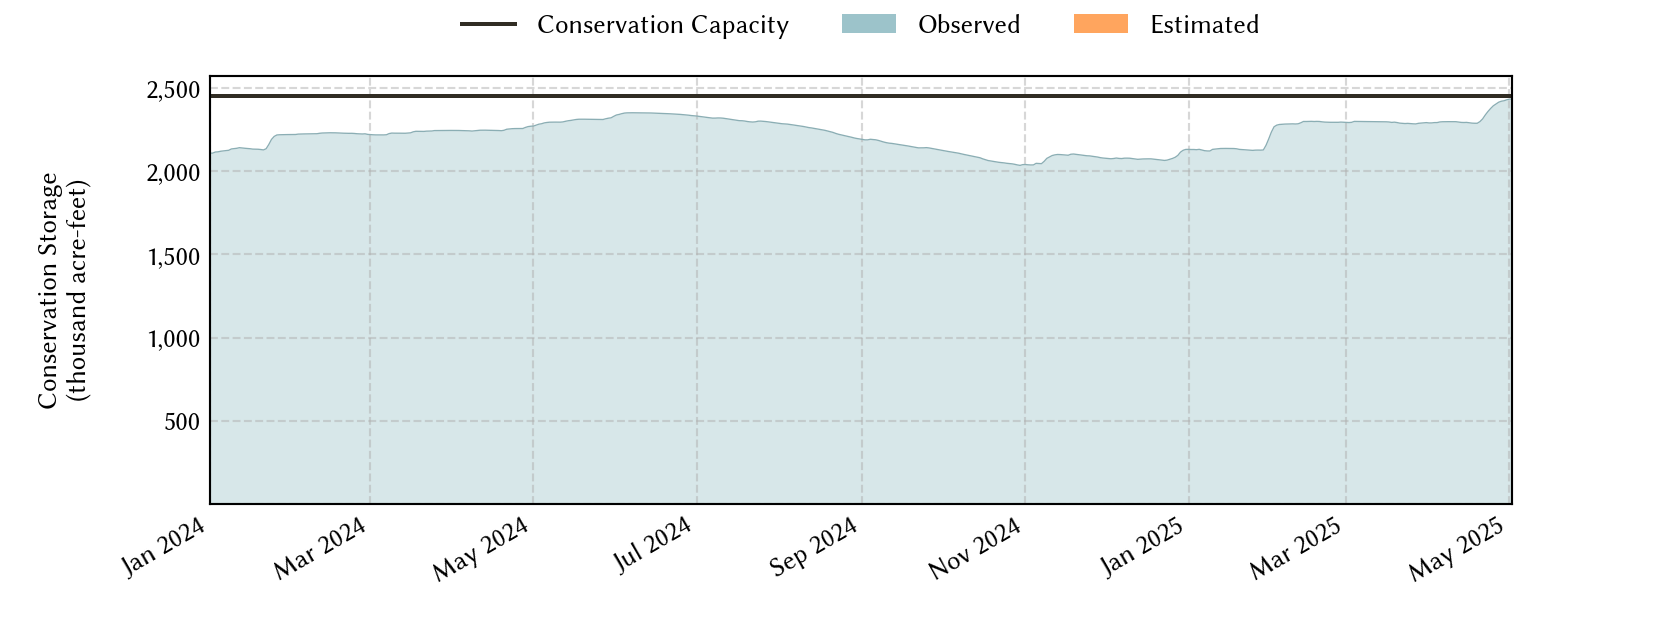
Fort Worth Area Reservoirs: Monitored Water Supply Reservoirs are 88.0% full on 2026-04-01
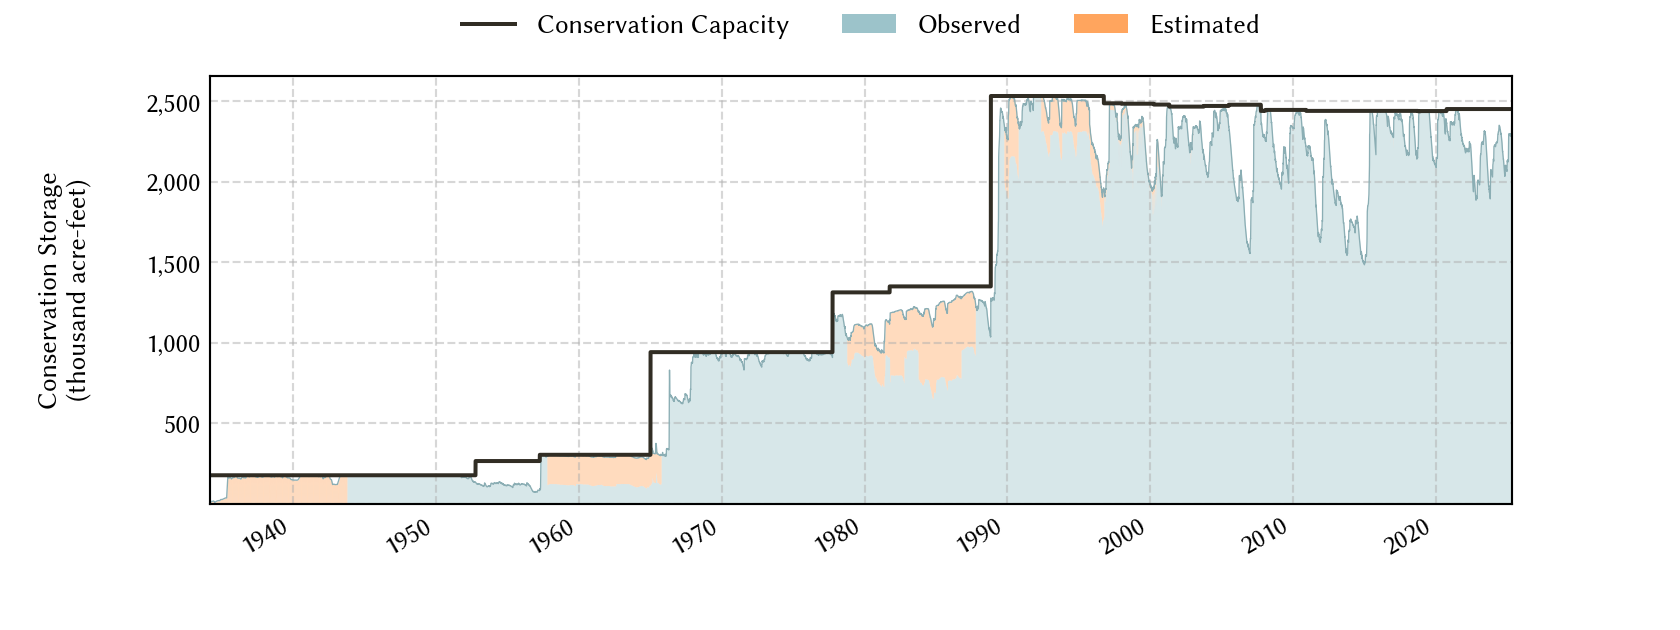
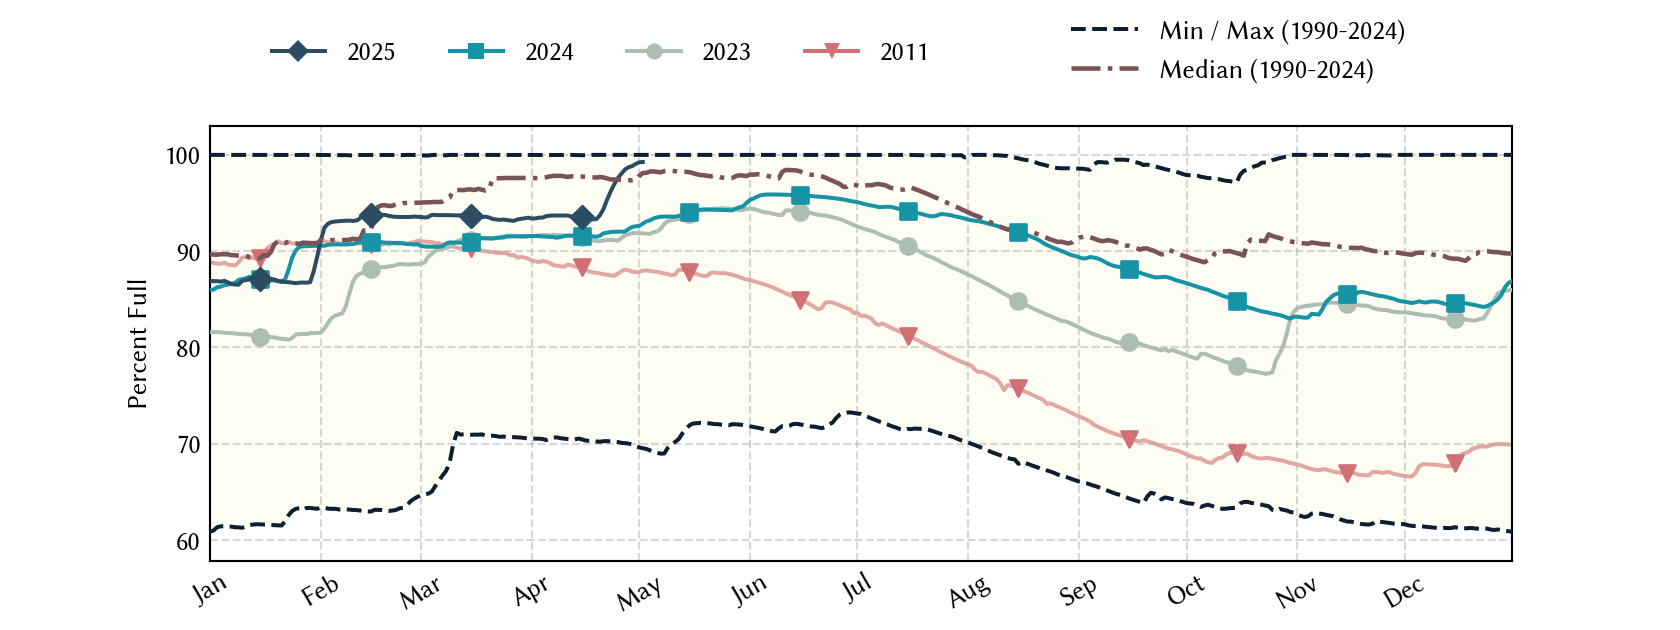
Historical Data
| Date | Percent Full |
Reservoir Storage (acre-ft) |
Conservation Storage (acre-ft) |
Conservation Capacity (acre-ft) |
|
|---|---|---|---|---|---|
| Today | 2026-04-01 | 88.0 | 2,192,358 | 2,157,368 | 2,451,597 |
| Yesterday | 2026-03-31 | 88.0 | 2,192,321 | 2,157,331 | 2,451,597 |
| 2 days ago | 2026-03-30 | 88.0 | 2,193,402 | 2,158,412 | 2,451,597 |
| 1 week ago | 2026-03-25 | 88.2 | 2,196,471 | 2,161,481 | 2,451,597 |
| 1 month ago | 2026-03-01 | 87.6 | 2,183,011 | 2,148,021 | 2,451,597 |
| 3 months ago | 2026-01-01 | 88.2 | 2,197,056 | 2,162,066 | 2,451,597 |
| 6 months ago | 2025-10-01 | 92.7 | 2,308,427 | 2,273,437 | 2,451,597 |
| 1 year ago | 2025-04-01 | 93.4 | 2,327,259 | 2,289,635 | 2,451,597 |
*
Percent Full is based on Conservation Storage and Conservation Capacity and doesn't account for storage in flood pool.
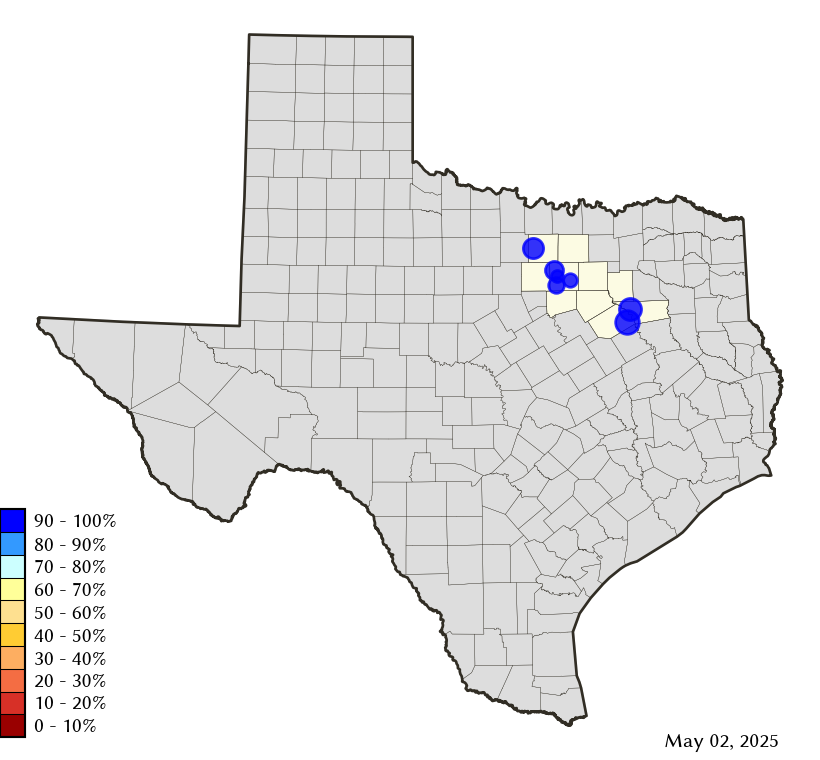
Area Map
Reservoir Storage
| Reservoir | Type | Percent Full |
Water Level (ft) |
Height Above Conservation Pool (ft) |
Reservoir Storage (acre-ft) |
Conservation Storage (acre-ft) |
Conservation Capacity (acre-ft) |
Surface Area (acres) |
|---|---|---|---|---|---|---|---|---|
| Arlington |

|
94.2 | 548.77 | -1.23 | 37,843 | 37,811 | 40,157 | 1,892 |
| Benbrook |

|
82.5 | 689.67 | -4.33 | 70,700 | 70,700 | 85,648 | 3,239 |
| Bridgeport |
|
85.0 | 831.24 | -4.76 | 316,336 | 316,336 | 372,183 | 11,219 |
| Cedar Creek |
|
84.0 | 318.67 | -3.33 | 541,420 | 541,321 | 644,686 | 29,558 |
| Eagle Mountain |
|
82.5 | 645.36 | -3.74 | 152,683 | 152,683 | 185,087 | 8,150 |
| Richland-Chambers |
|
92.8 | 313.16 | -1.84 | 1,045,825 | 1,020,042 | 1,099,417 | 42,403 |
| Worth |
|
75.7 | 592.21 | -1.79 | 27,551 | 18,475 | 24,419 | 3,213 |