San-Antonio River Basin Reservoirs: Monitored Water Supply Reservoirs are 3.9% full on 2026-04-01
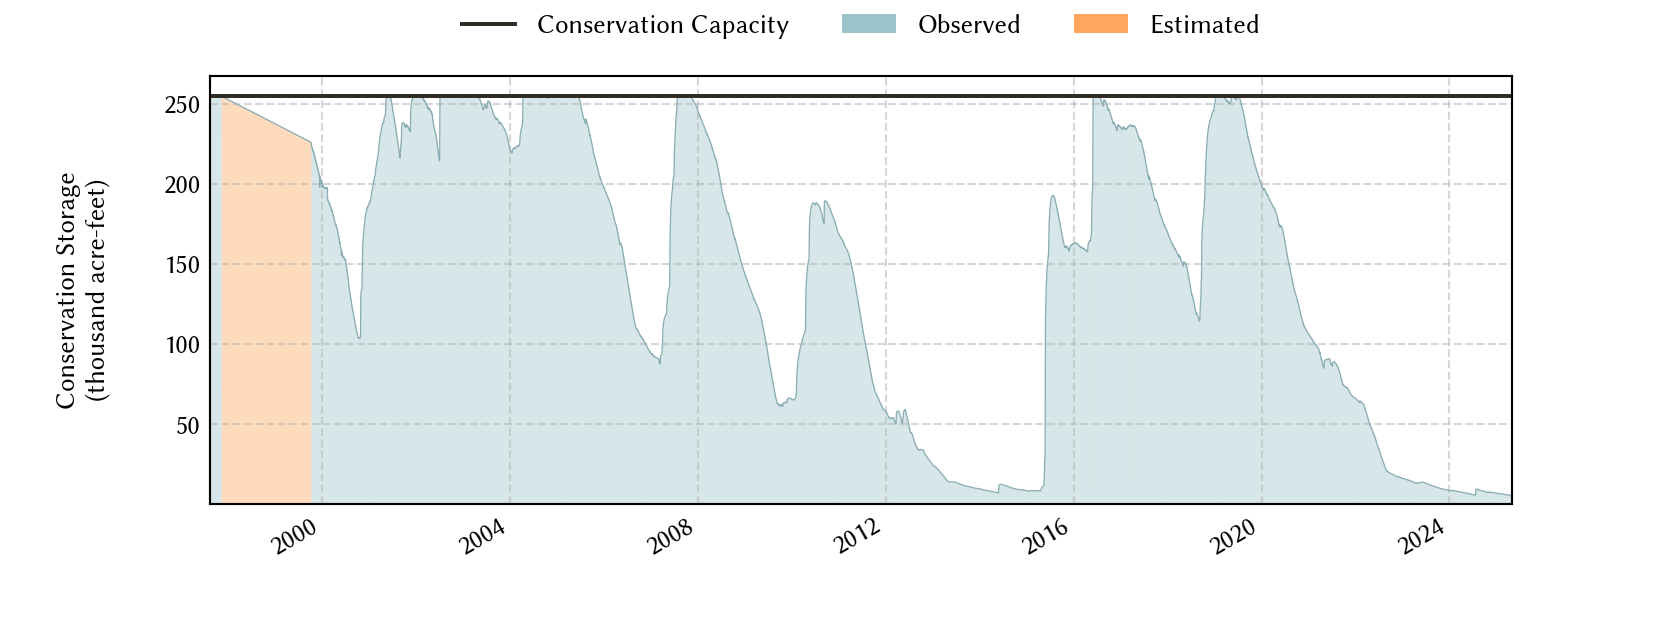
Historical Data
| Date | Percent Full |
Reservoir Storage (acre-ft) |
Conservation Storage (acre-ft) |
Conservation Capacity (acre-ft) |
|
|---|---|---|---|---|---|
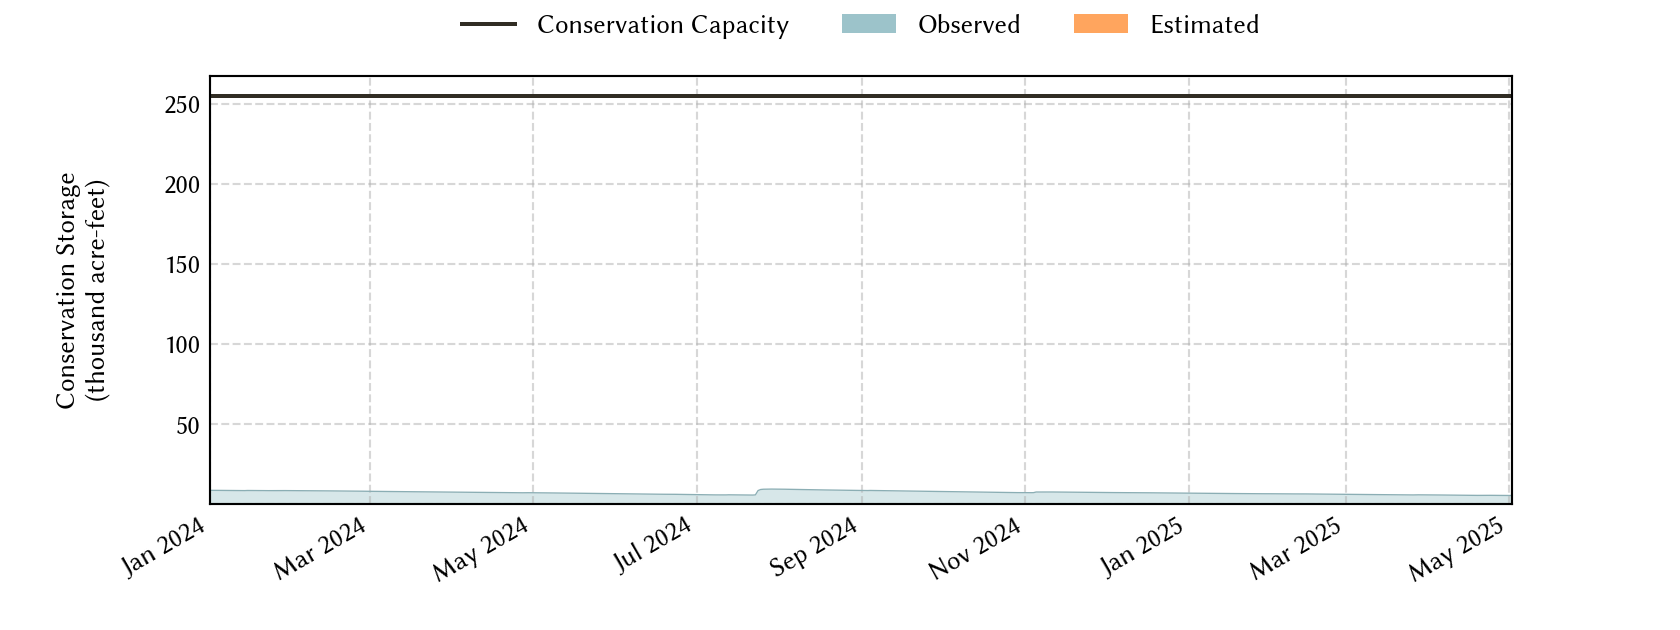
| Today | 2026-04-01 | 3.9 | 10,044 | 10,044 | 254,823 |
| Yesterday | 2026-03-31 | 4.0 | 10,066 | 10,066 | 254,823 |
| 2 days ago | 2026-03-30 | 4.0 | 10,088 | 10,088 | 254,823 |
| 1 week ago | 2026-03-25 | 4.0 | 10,227 | 10,227 | 254,823 |
| 1 month ago | 2026-03-01 | 4.2 | 10,741 | 10,741 | 254,823 |
| 3 months ago | 2026-01-01 | 4.7 | 11,974 | 11,974 | 254,823 |
| 6 months ago | 2025-10-01 | 5.8 | 14,729 | 14,729 | 254,823 |
| 1 year ago | 2025-04-01 | 2.2 | 5,692 | 5,692 | 254,823 |
*
Percent Full is based on Conservation Storage and Conservation Capacity and doesn't account for storage in flood pool.
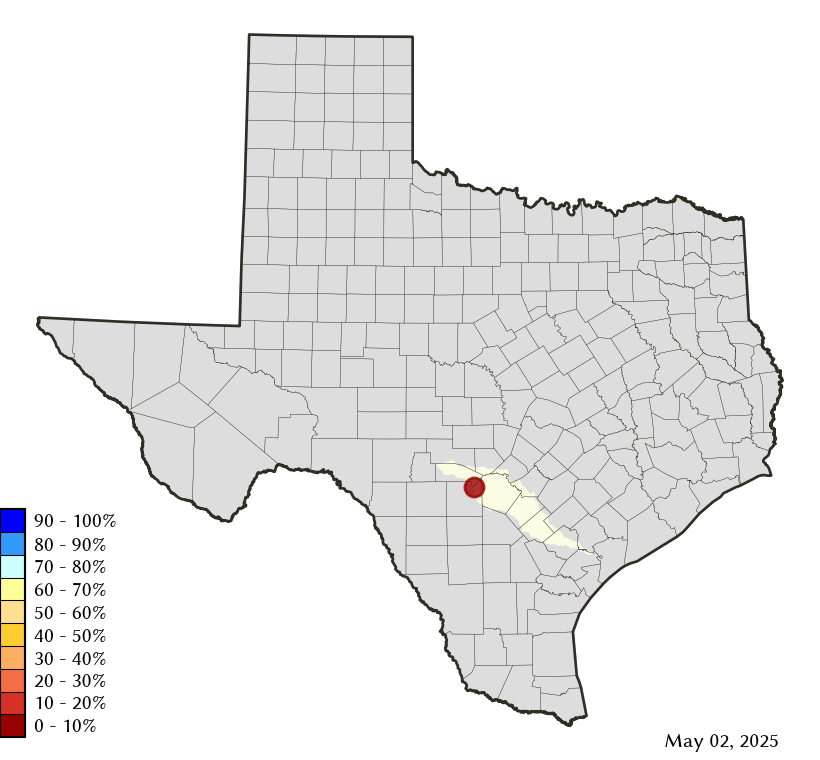
Area Map
Reservoir Storage
| Reservoir | Type | Percent Full |
Water Level (ft) |
Height Above Conservation Pool (ft) |
Reservoir Storage (acre-ft) |
Conservation Storage (acre-ft) |
Conservation Capacity (acre-ft) |
Surface Area (acres) |
|---|---|---|---|---|---|---|---|---|
| Medina |

|
3.9 | 977.06 | -87.14 | 10,044 | 10,044 | 254,823 | 729 |