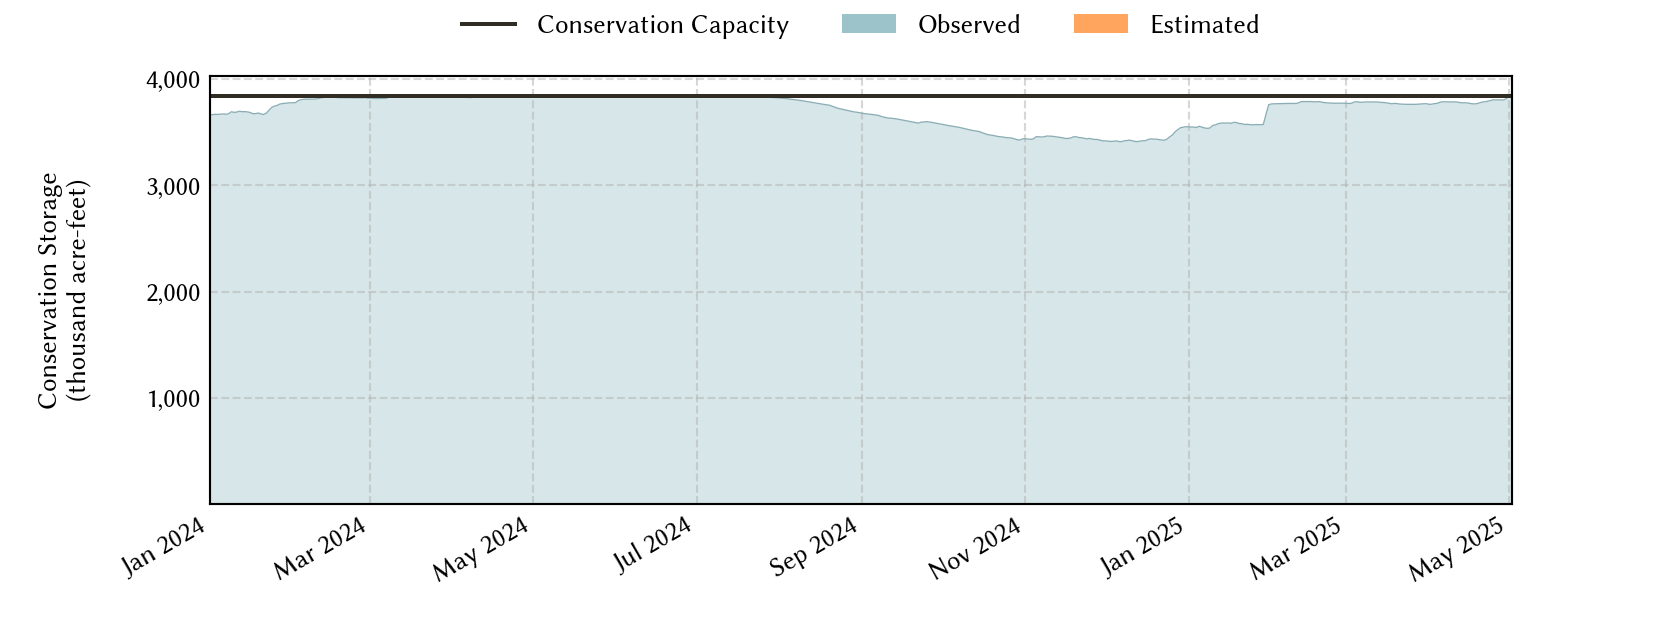
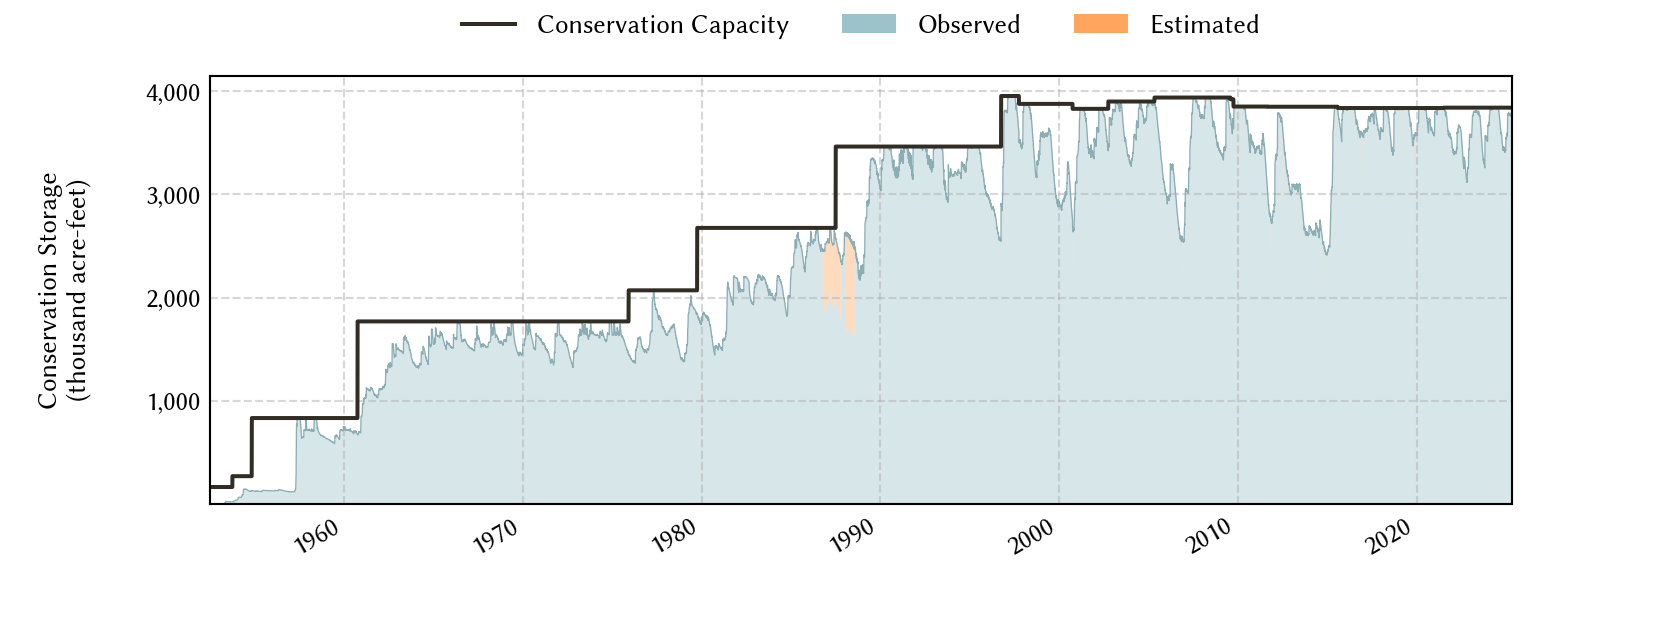
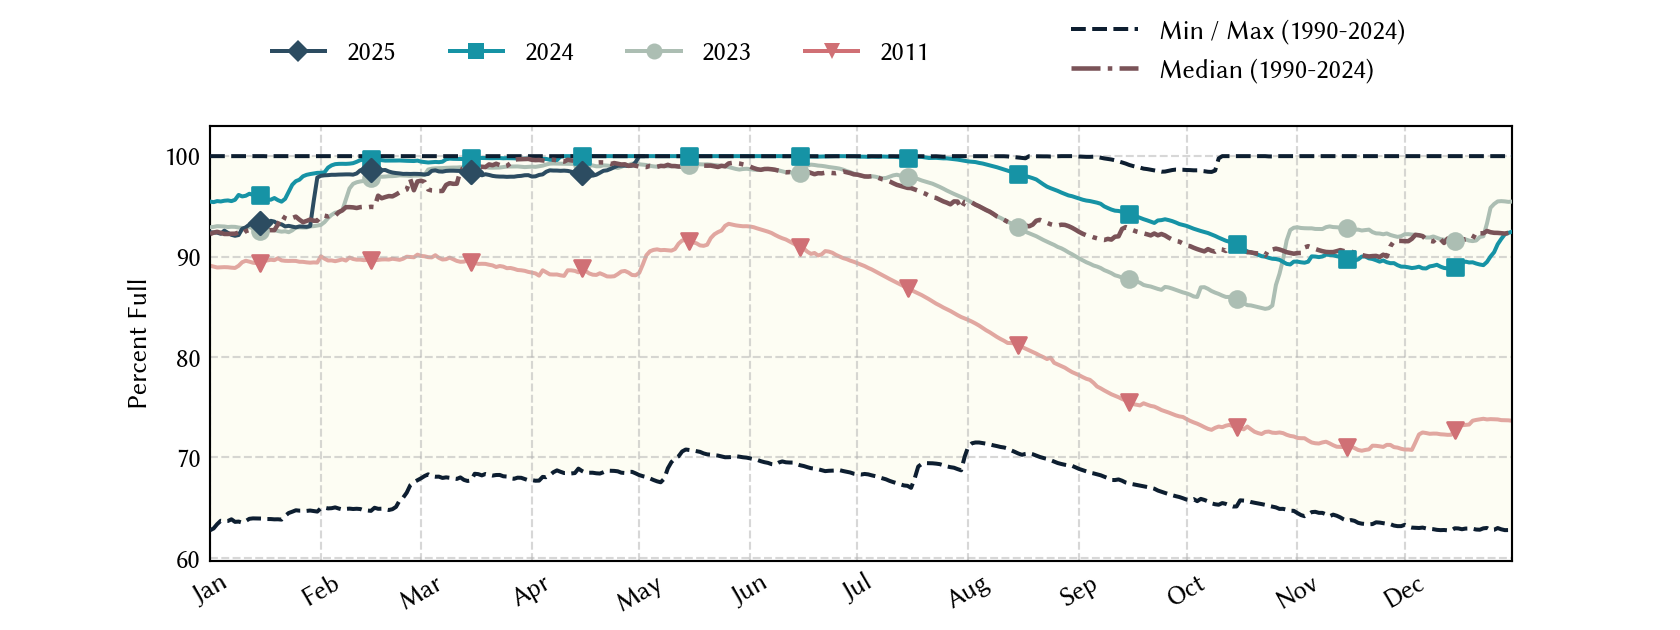
Dallas Area Reservoirs: Monitored Water Supply Reservoirs are 96.7% full on 2026-04-01
Historical Data
| Date | Percent Full |
Reservoir Storage (acre-ft) |
Conservation Storage (acre-ft) |
Conservation Capacity (acre-ft) |
|
|---|---|---|---|---|---|
| Today | 2026-04-01 | 96.7 | 3,786,420 | 3,715,537 | 3,841,548 |
| Yesterday | 2026-03-31 | 96.7 | 3,787,240 | 3,716,423 | 3,841,548 |
| 2 days ago | 2026-03-30 | 96.8 | 3,790,423 | 3,719,606 | 3,841,548 |
| 1 week ago | 2026-03-25 | 97.1 | 3,807,395 | 3,731,468 | 3,841,548 |
| 1 month ago | 2026-03-01 | 95.5 | 3,742,511 | 3,667,800 | 3,841,548 |
| 3 months ago | 2026-01-01 | 93.6 | 3,664,525 | 3,594,236 | 3,841,548 |
| 6 months ago | 2025-10-01 | 94.8 | 3,713,876 | 3,643,587 | 3,841,548 |
| 1 year ago | 2025-04-01 | 97.9 | 3,856,874 | 3,762,413 | 3,841,548 |
*
Percent Full is based on Conservation Storage and Conservation Capacity and doesn't account for storage in flood pool.
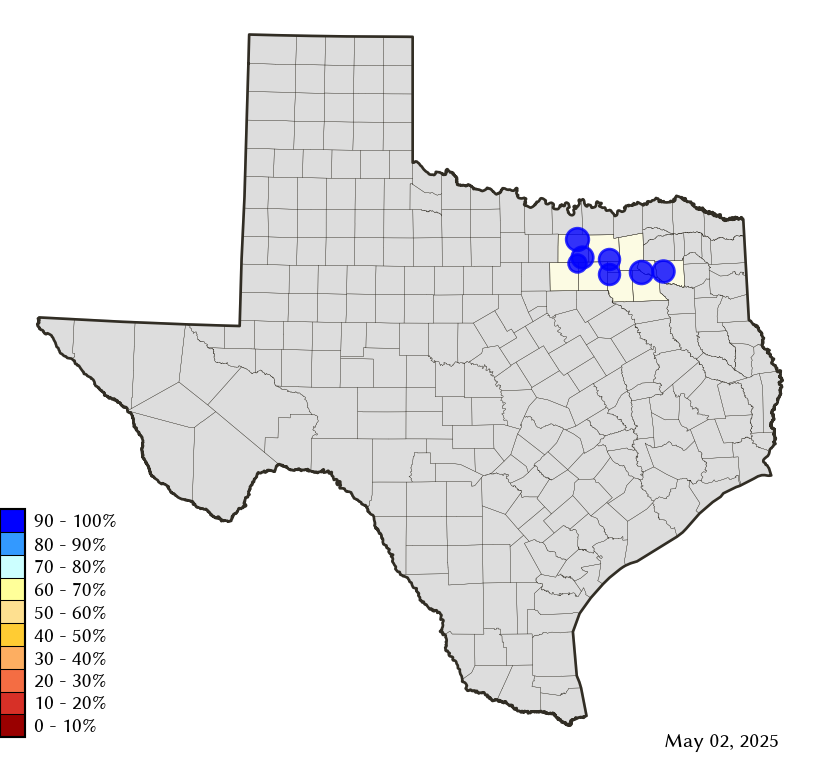
Area Map
Reservoir Storage
| Reservoir | Type | Percent Full |
Water Level (ft) |
Height Above Conservation Pool (ft) |
Reservoir Storage (acre-ft) |
Conservation Storage (acre-ft) |
Conservation Capacity (acre-ft) |
Surface Area (acres) |
|---|---|---|---|---|---|---|---|---|
| Fork |

|
87.2 | 399.96 | -3.04 | 559,986 | 528,543 | 606,088 | 24,142 |
| Grapevine |

|
100.0 | 535.09 | 0.09 | 163,658 | 163,064 | 163,064 | - n.a. - |
| Lavon |
|
97.9 | 491.59 | -0.41 | 404,182 | 401,341 | 409,757 | 20,436 |
| Lewisville |
|
99.6 | 521.91 | -0.09 | 596,473 | 560,799 | 563,228 | 26,976 |
| Ray Hubbard |
|
99.3 | 435.35 | -0.15 | 436,432 | 436,432 | 439,559 | 20,763 |
| Ray Roberts |
|
99.9 | 632.48 | -0.02 | 787,923 | 787,600 | 788,167 | 28,578 |
| Tawakoni |
|
96.1 | 436.57 | -0.93 | 837,766 | 837,758 | 871,685 | 36,010 |