South-Central Climate Division Reservoirs: Monitored Water Supply Reservoirs are 61.9% full on 2026-04-01
Historical Data
| Date | Percent Full |
Reservoir Storage (acre-ft) |
Conservation Storage (acre-ft) |
Conservation Capacity (acre-ft) |
|
|---|---|---|---|---|---|
| Today | 2026-04-01 | 61.9 | 1,217,652 | 1,199,940 | 1,936,953 |
| Yesterday | 2026-03-31 | 62.1 | 1,219,790 | 1,202,078 | 1,936,953 |
| 2 days ago | 2026-03-30 | 62.2 | 1,222,492 | 1,204,780 | 1,936,953 |
| 1 week ago | 2026-03-25 | 62.9 | 1,236,816 | 1,219,104 | 1,936,953 |
| 1 month ago | 2026-03-01 | 64.0 | 1,257,714 | 1,240,002 | 1,936,953 |
| 3 months ago | 2026-01-01 | 66.0 | 1,295,337 | 1,277,625 | 1,936,953 |
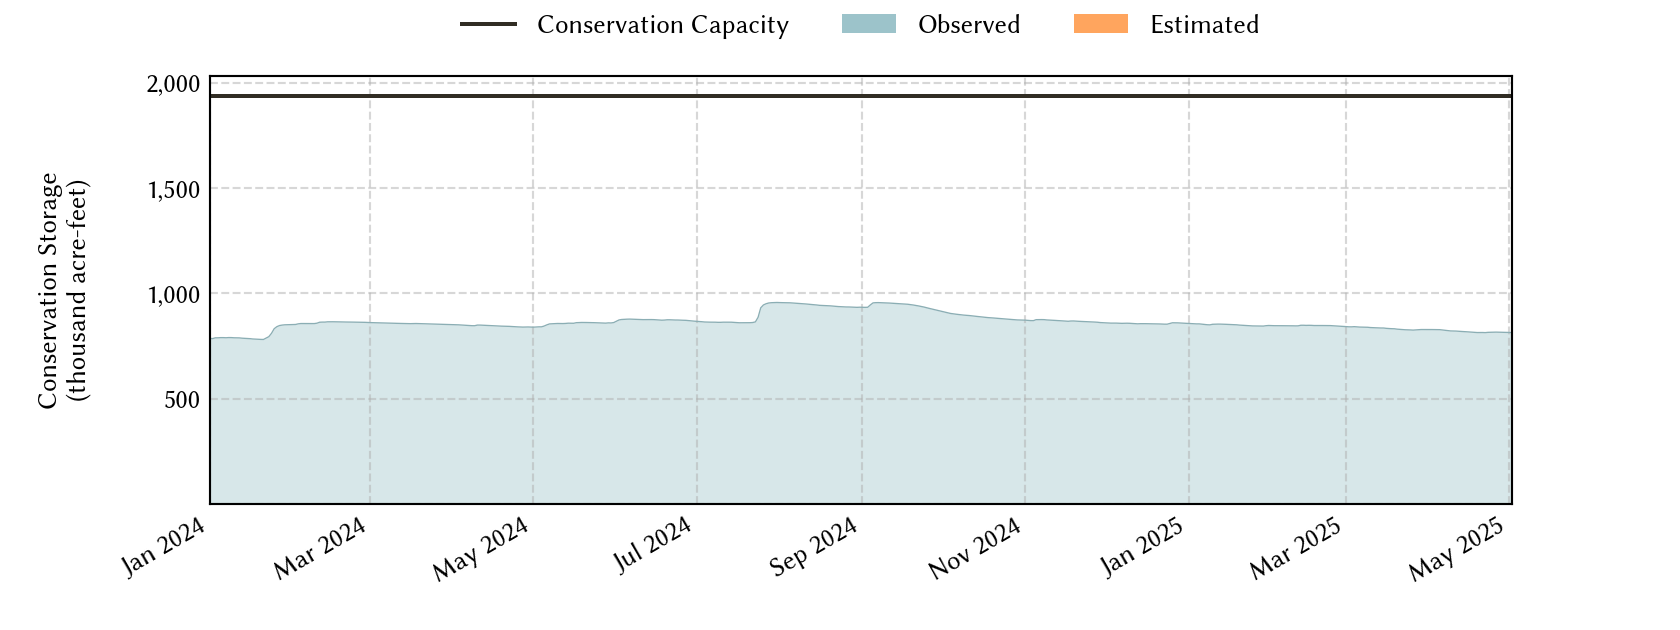
| 6 months ago | 2025-10-01 | 71.4 | 1,401,234 | 1,383,522 | 1,936,953 |
| 1 year ago | 2025-04-01 | 42.8 | 846,225 | 828,513 | 1,936,953 |
*
Percent Full is based on Conservation Storage and Conservation Capacity and doesn't account for storage in flood pool.
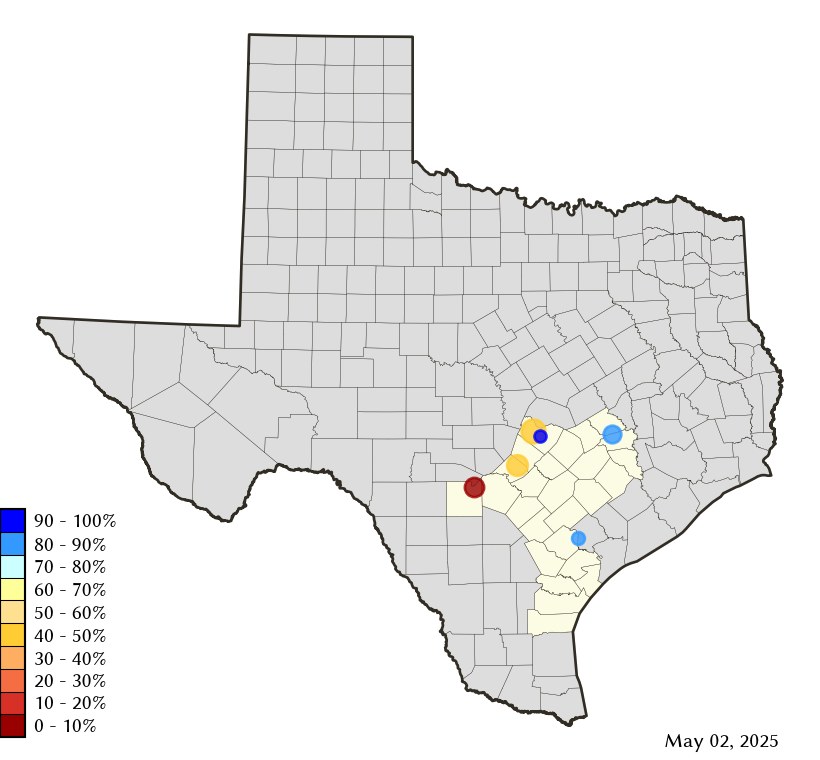
Area Map
Reservoir Storage
| Reservoir | Type | Percent Full |
Water Level (ft) |
Height Above Conservation Pool (ft) |
Reservoir Storage (acre-ft) |
Conservation Storage (acre-ft) |
Conservation Capacity (acre-ft) |
Surface Area (acres) |
|---|---|---|---|---|---|---|---|---|
| Austin |

|
97.3 | 492.39 | -0.41 | 23,938 | 23,329 | 23,972 | 1,556 |
| Canyon |

|
59.0 | 886.75 | -22.25 | 223,422 | 223,351 | 378,781 | 5,822 |
| Coleto Creek |
|
75.4 | 94.75 | -3.25 | 23,416 | 23,416 | 31,040 | 2,194 |
| Medina |
|
3.9 | 977.06 | -87.14 | 10,044 | 10,044 | 254,823 | 729 |
| Somerville |
|
72.8 | 234.09 | -3.91 | 109,460 | 109,460 | 150,293 | 9,646 |
| Travis |
|
73.8 | 664.13 | -16.87 | 827,372 | 810,340 | 1,098,044 | 15,069 |