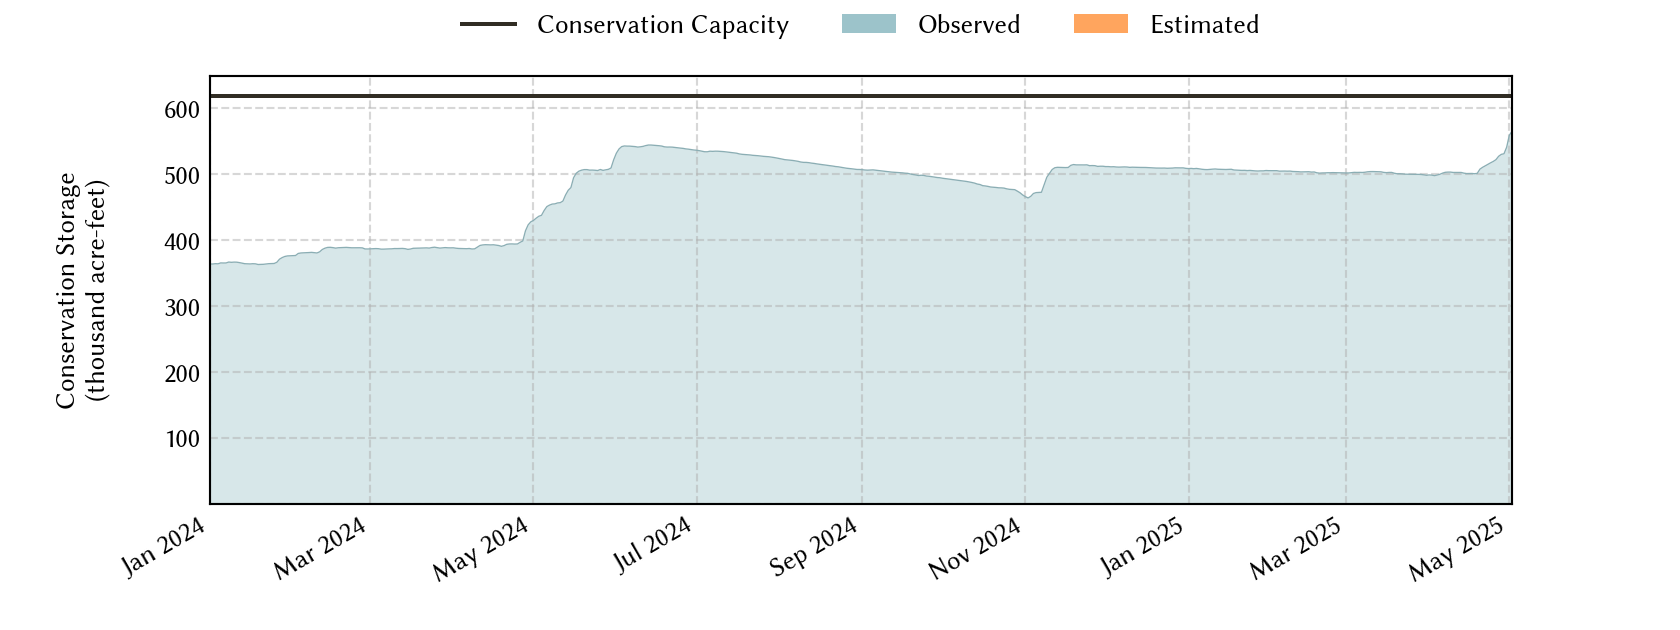
Region-B Planning Region Reservoirs: Monitored Water Supply Reservoirs are 85.2% full on 2026-04-01
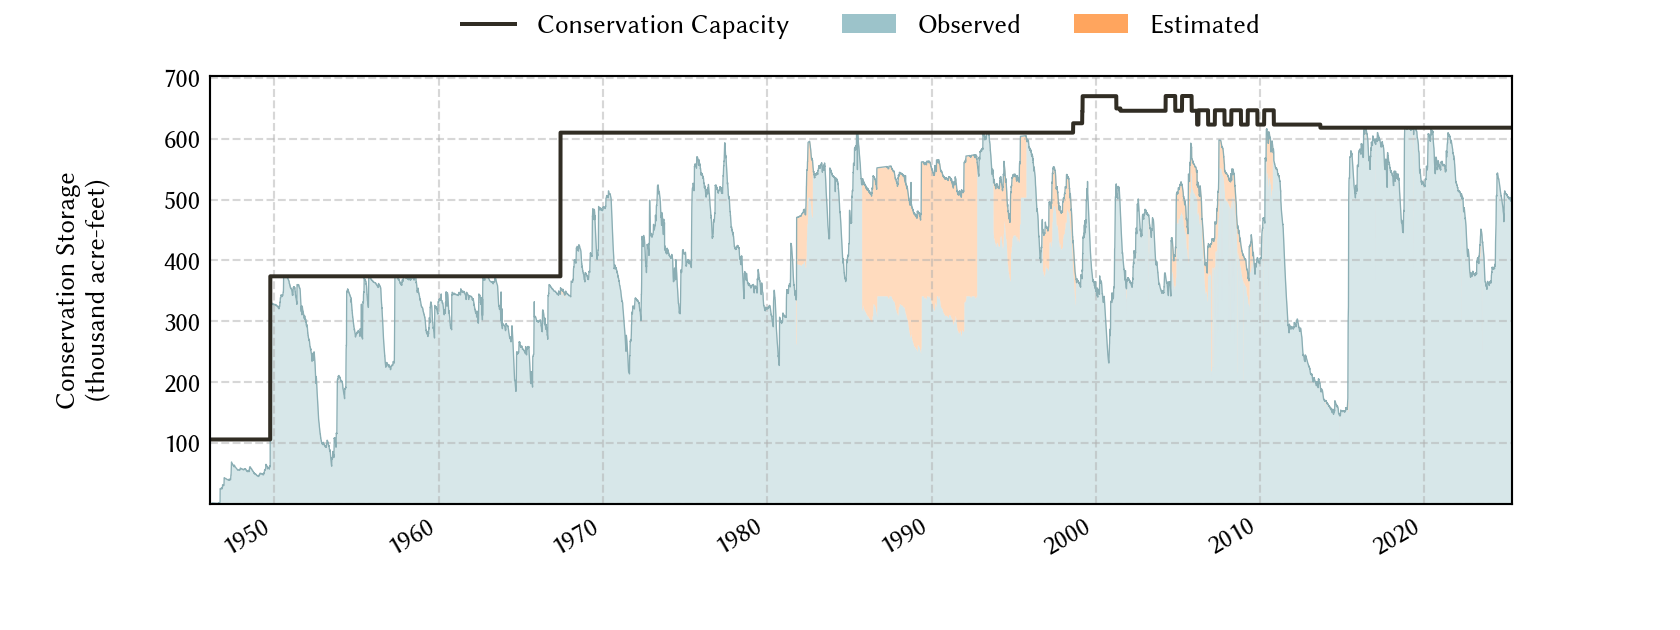
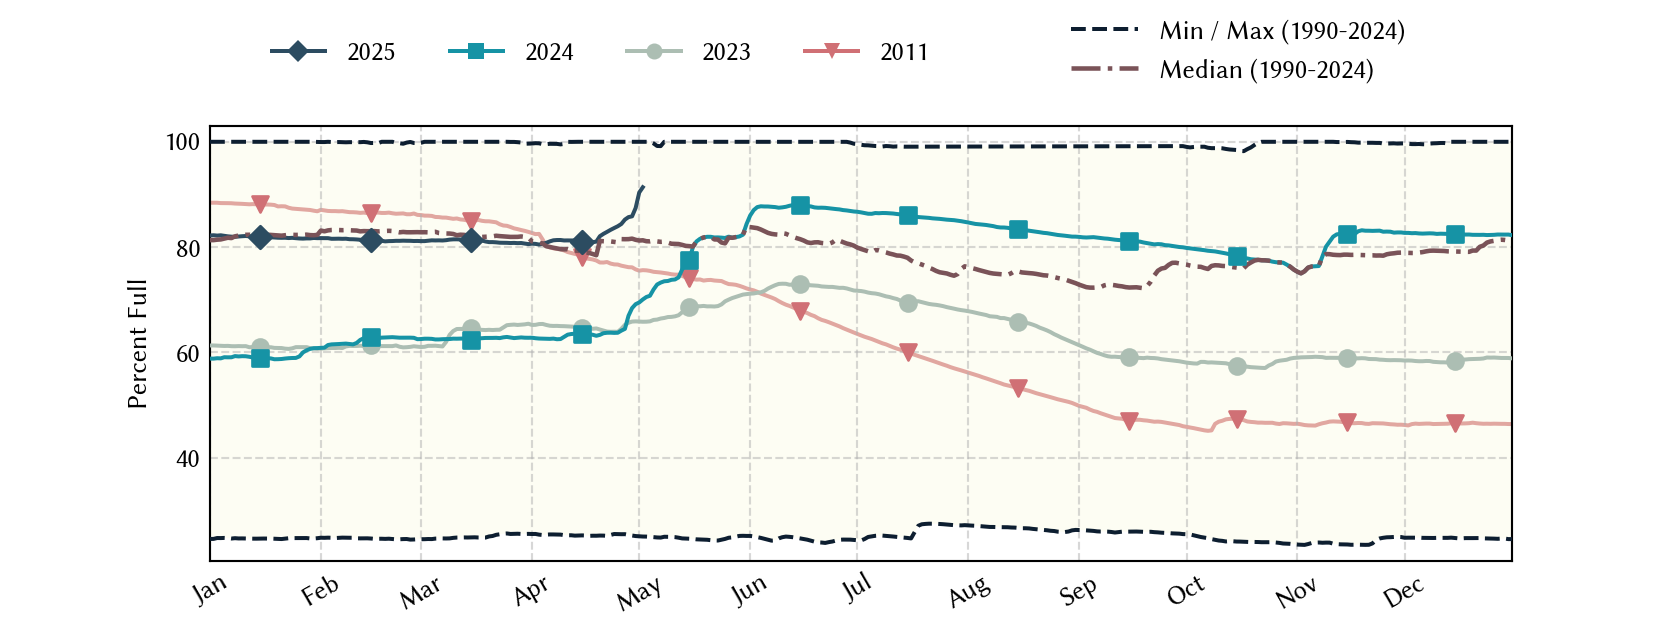
Historical Data
| Date | Percent Full |
Reservoir Storage (acre-ft) |
Conservation Storage (acre-ft) |
Conservation Capacity (acre-ft) |
|
|---|---|---|---|---|---|
| Today | 2026-04-01 | 85.2 | 527,860 | 526,646 | 618,121 |
| Yesterday | 2026-03-31 | 85.4 | 528,818 | 527,604 | 618,121 |
| 2 days ago | 2026-03-30 | 85.7 | 531,085 | 529,871 | 618,121 |
| 1 week ago | 2026-03-25 | 87.6 | 542,444 | 541,230 | 618,121 |
| 1 month ago | 2026-03-01 | 88.9 | 550,806 | 549,592 | 618,121 |
| 3 months ago | 2026-01-01 | 90.0 | 557,355 | 556,141 | 618,121 |
| 6 months ago | 2025-10-01 | 94.5 | 592,791 | 584,175 | 618,121 |
| 1 year ago | 2025-04-01 | 80.7 | 503,115 | 498,522 | 618,121 |
*
Percent Full is based on Conservation Storage and Conservation Capacity and doesn't account for storage in flood pool.
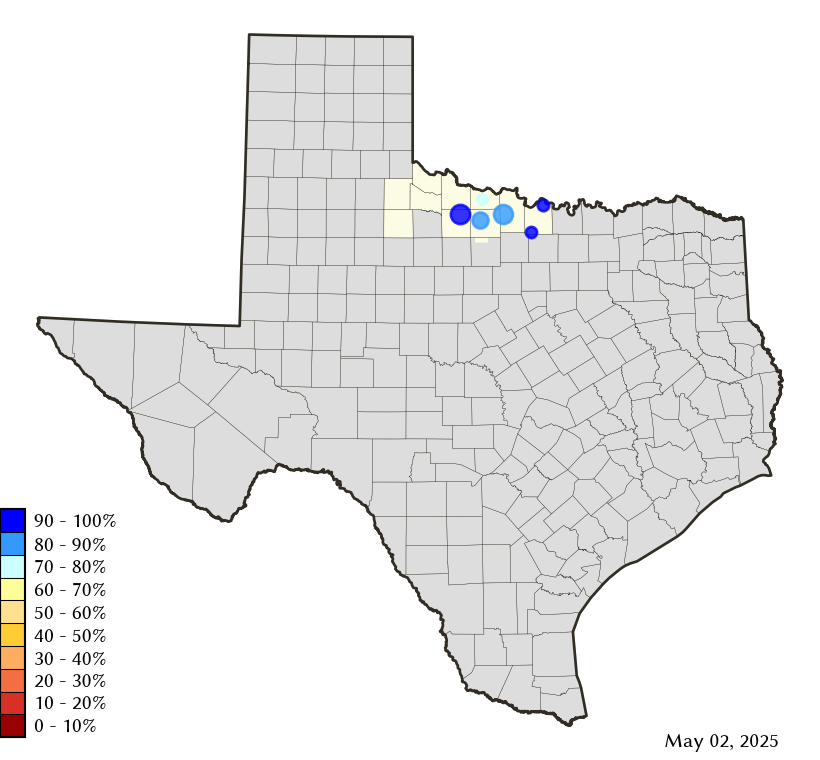
Area Map
Reservoir Storage
| Reservoir | Type | Percent Full |
Water Level (ft) |
Height Above Conservation Pool (ft) |
Reservoir Storage (acre-ft) |
Conservation Storage (acre-ft) |
Conservation Capacity (acre-ft) |
Surface Area (acres) |
|---|---|---|---|---|---|---|---|---|
| Amon G Carter |

|
84.9 | 917.93 | -2.07 | 17,147 | 16,363 | 19,266 | 1,334 |
| Arrowhead |
|
80.5 | 922.71 | -3.29 | 185,426 | 185,426 | 230,359 | 12,809 |
| Kemp |

|
91.0 | 1,142.53 | -1.47 | 223,466 | 223,340 | 245,307 | 14,565 |
| Kickapoo |
|
82.6 | 1,042.30 | -2.70 | 71,341 | 71,341 | 86,345 | 5,250 |
| Nocona |
|
84.4 | 824.91 | -2.59 | 18,397 | 18,093 | 21,444 | 1,247 |
| North Fork Buffalo Creek |
|
78.5 | 1,045.88 | -2.12 | 12,083 | 12,083 | 15,400 | 1,285 |