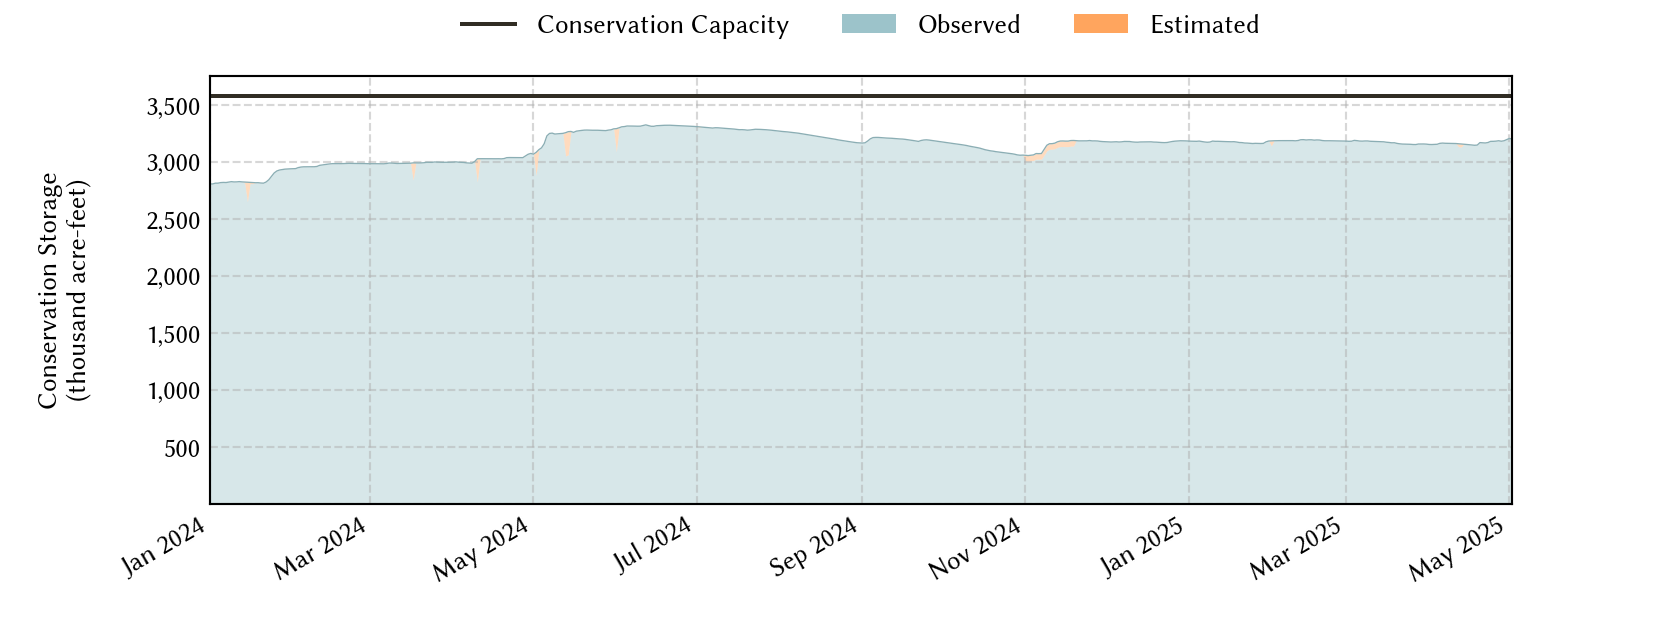
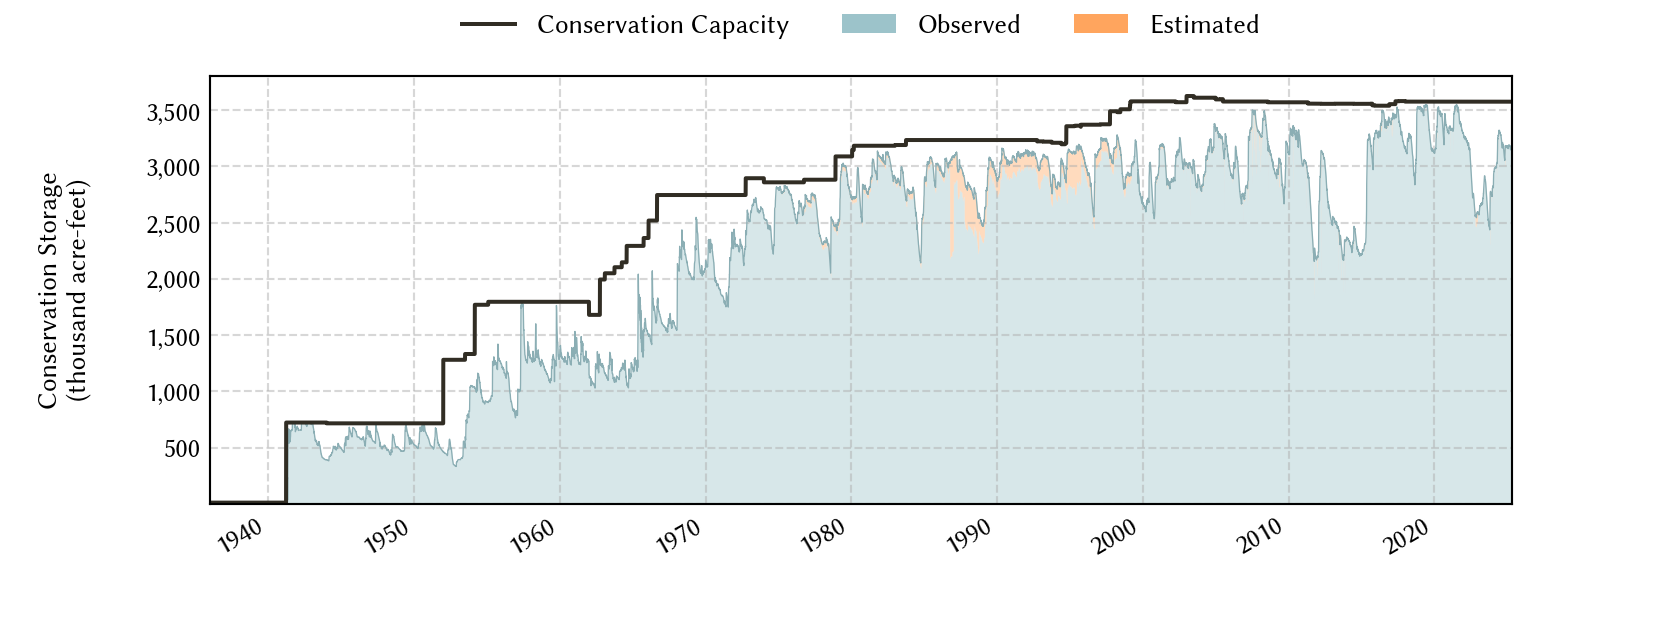
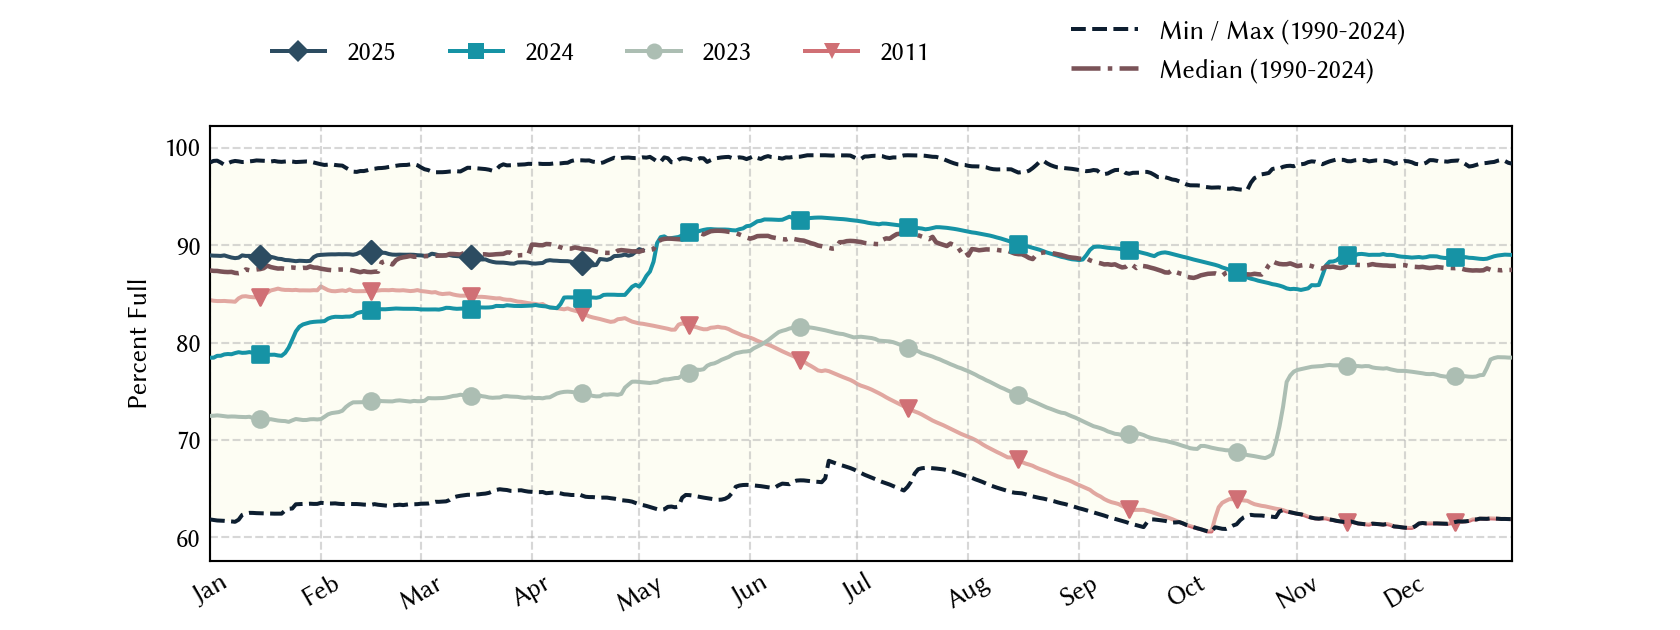
Brazos River Basin Reservoirs: Monitored Water Supply Reservoirs are 84.8% full on 2026-04-01
Historical Data
| Date | Percent Full |
Reservoir Storage (acre-ft) |
Conservation Storage (acre-ft) |
Conservation Capacity (acre-ft) |
|
|---|---|---|---|---|---|
| Today | 2026-04-01 | 84.8 | 3,044,852 | 3,033,232 | 3,576,076 |
| Yesterday | 2026-03-31 | 84.9 | 3,046,715 | 3,035,054 | 3,576,076 |
| 2 days ago | 2026-03-30 | 85.0 | 3,050,883 | 3,039,181 | 3,576,076 |
| 1 week ago | 2026-03-25 | 85.5 | 3,070,160 | 3,058,085 | 3,576,076 |
| 1 month ago | 2026-03-01 | 85.7 | 3,077,358 | 3,064,951 | 3,576,076 |
| 3 months ago | 2026-01-01 | 86.6 | 3,107,319 | 3,096,070 | 3,576,076 |
| 6 months ago | 2025-10-01 | 90.0 | 3,230,739 | 3,218,252 | 3,576,076 |
| 1 year ago | 2025-04-01 | 88.1 | 3,169,036 | 3,150,928 | 3,576,076 |
*
Percent Full is based on Conservation Storage and Conservation Capacity and doesn't account for storage in flood pool.
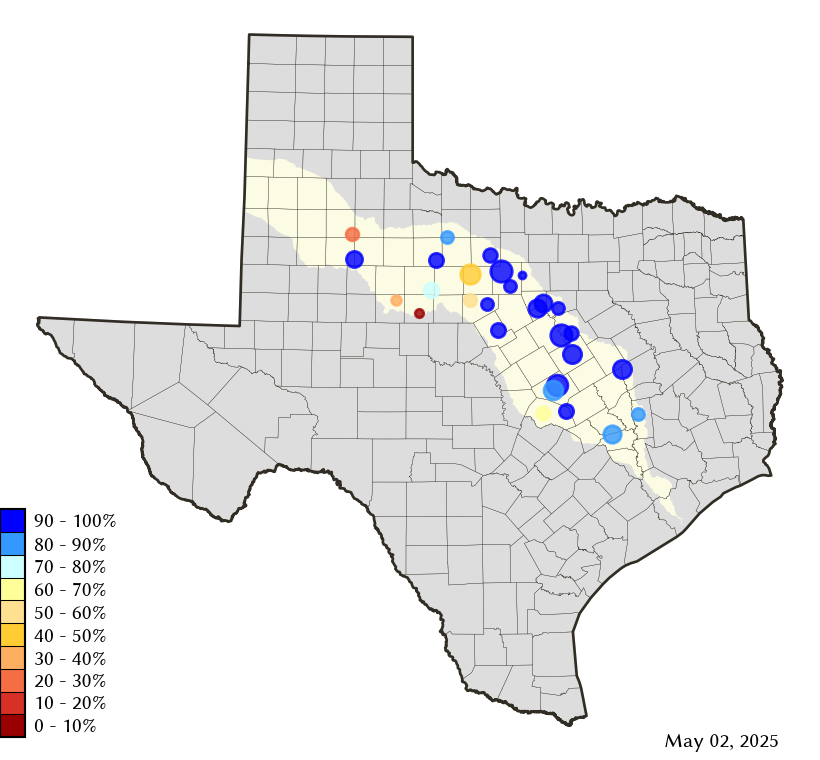
Area Map
Reservoir Storage
| Reservoir | Type | Percent Full |
Water Level (ft) |
Height Above Conservation Pool (ft) |
Reservoir Storage (acre-ft) |
Conservation Storage (acre-ft) |
Conservation Capacity (acre-ft) |
Surface Area (acres) |
|---|---|---|---|---|---|---|---|---|
| Abilene |

|
3.6 | 1,988.44 | -23.86 | 285 | 285 | 7,900 | 91 |
| Alan Henry |
|
82.8 | 2,213.59 | -6.41 | 79,701 | 79,701 | 96,207 | 2,366 |
| Aquilla |

|
92.0 | 536.36 | -1.14 | 39,838 | 39,802 | 43,243 | 2,948 |
| Belton |
|
96.5 | 592.76 | -1.24 | 417,402 | 417,402 | 432,631 | 12,119 |
| Cisco |
|
47.2 | 1,505.36 | -17.10 | 13,701 | 13,701 | 29,003 | 632 |
| Comanche Creek |
|
99.9 | 774.96 | -0.04 | 151,146 | 151,123 | 151,250 | 3,165 |
| Fort Phantom Hill |
|
71.4 | 1,630.15 | -5.75 | 50,024 | 50,018 | 70,030 | 3,090 |
| Georgetown |
|
75.8 | 783.37 | -7.63 | 28,871 | 28,808 | 38,005 | 1,106 |
| Gibbons Creek |
|
96.6 | 246.66 | -0.34 | 26,563 | 24,859 | 25,721 | 2,516 |
| Graham |
|
75.6 | 1,070.21 | -4.79 | 34,257 | 34,243 | 45,288 | 2,112 |
| Granbury |
|
97.9 | 692.36 | -0.34 | 131,101 | 130,192 | 132,949 | 8,048 |
| Granger |
|
100.0 | 504.09 | 0.09 | 52,193 | 51,822 | 51,822 | - n.a. - |
| Hubbard Creek |
|
41.3 | 1,168.08 | -15.23 | 134,282 | 129,406 | 313,298 | 8,725 |
| Leon |
|
80.8 | 1,371.73 | -3.27 | 22,724 | 22,444 | 27,762 | 1,499 |
| Limestone |
|
83.7 | 360.21 | -2.79 | 170,630 | 170,630 | 203,780 | 11,261 |
| Millers Creek |
|
67.9 | 1,329.47 | -4.53 | 19,456 | 18,173 | 26,768 | 1,556 |
| Mineral Wells |
|
93.8 | 862.29 | -0.71 | 4,948 | 4,948 | 5,273 | 450 |
| Palo Pinto |
|
93.3 | 866.17 | -0.83 | 25,361 | 24,975 | 26,766 | 2,141 |
| Pat Cleburne |
|
95.4 | 732.73 | -0.77 | 24,812 | 24,812 | 26,008 | 1,542 |
| Possum Kingdom |
|
90.3 | 995.97 | -3.03 | 485,977 | 485,977 | 538,139 | 16,490 |
| Proctor |
|
75.0 | 1,158.85 | -3.15 | 41,088 | 41,088 | 54,762 | 3,977 |
| Somerville |
|
72.8 | 234.09 | -3.91 | 109,460 | 109,460 | 150,293 | 9,646 |
| Stamford |
|
77.6 | 1,414.57 | -2.23 | 40,009 | 40,006 | 51,570 | 4,257 |
| Stillhouse Hollow |
|
92.8 | 619.34 | -2.66 | 213,269 | 213,183 | 229,796 | 6,068 |
| Sweetwater |
|
23.4 | 2,094.22 | -22.28 | 2,867 | 2,867 | 12,267 | 247 |
| Waco |
|
97.3 | 461.62 | -0.60 | 184,085 | 183,859 | 188,891 | 8,334 |
| White River |
|
27.9 | 2,352.04 | -20.16 | 8,871 | 8,871 | 31,846 | 766 |
| Whitney |
|
93.9 | 531.48 | -1.52 | 531,931 | 530,577 | 564,808 | 21,825 |