Lower-Colorado Planning Region Reservoirs: Monitored Water Supply Reservoirs are 83.9% full on 2026-04-01
Historical Data
| Date | Percent Full |
Reservoir Storage (acre-ft) |
Conservation Storage (acre-ft) |
Conservation Capacity (acre-ft) |
|
|---|---|---|---|---|---|
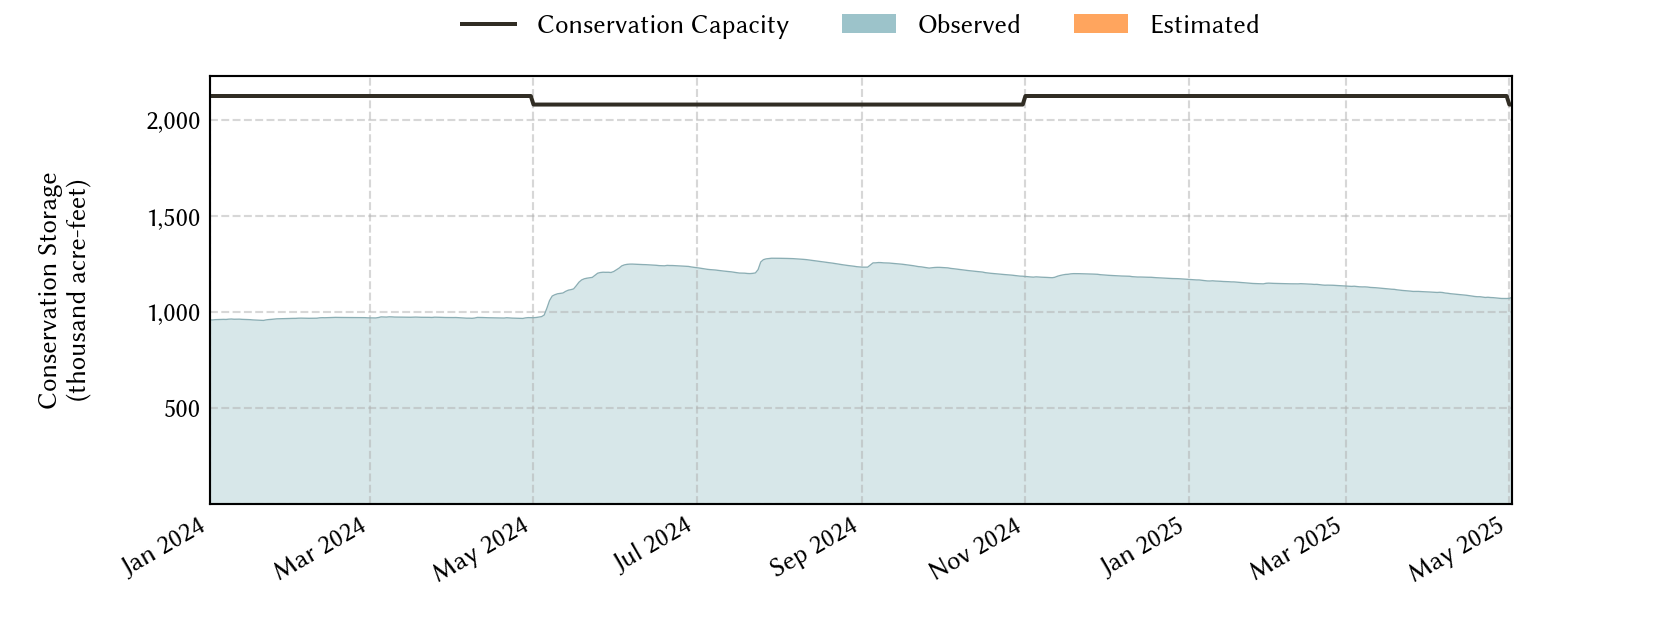
| Today | 2026-04-01 | 83.9 | 1,830,529 | 1,780,103 | 2,122,814 |
| Yesterday | 2026-03-31 | 83.9 | 1,832,392 | 1,781,966 | 2,122,814 |
| 2 days ago | 2026-03-30 | 84.0 | 1,834,243 | 1,783,817 | 2,122,814 |
| 1 week ago | 2026-03-25 | 84.5 | 1,844,206 | 1,793,780 | 2,122,814 |
| 1 month ago | 2026-03-01 | 85.1 | 1,856,734 | 1,806,308 | 2,122,814 |
| 3 months ago | 2026-01-01 | 87.1 | 1,899,854 | 1,849,428 | 2,122,814 |
| 6 months ago | 2025-10-01 | 89.9 | 1,958,475 | 1,908,049 | 2,122,814 |
| 1 year ago | 2025-04-01 | 52.0 | 1,153,551 | 1,103,125 | 2,122,814 |
*
Percent Full is based on Conservation Storage and Conservation Capacity and doesn't account for storage in flood pool.
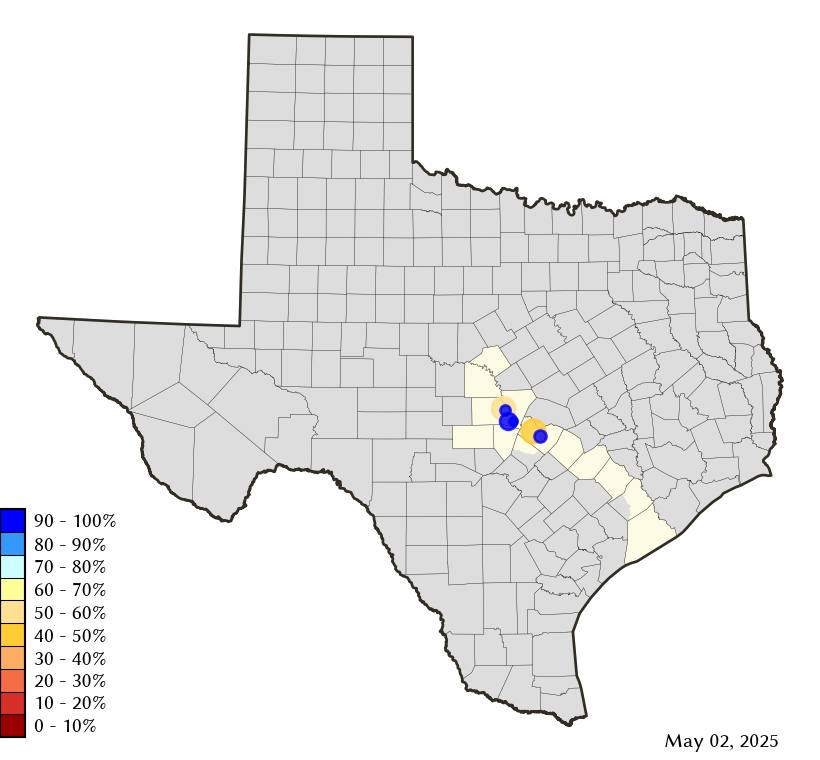
Area Map
Reservoir Storage
| Reservoir | Type | Percent Full |
Water Level (ft) |
Height Above Conservation Pool (ft) |
Reservoir Storage (acre-ft) |
Conservation Storage (acre-ft) |
Conservation Capacity (acre-ft) |
Surface Area (acres) |
|---|---|---|---|---|---|---|---|---|
| Austin |

|
97.3 | 492.39 | -0.41 | 23,938 | 23,329 | 23,972 | 1,556 |
| Buchanan |
|
94.0 | 1,017.65 | -2.35 | 828,160 | 814,498 | 866,694 | 21,996 |
| Inks |
|
95.8 | 887.27 | -0.73 | 13,430 | 13,147 | 13,729 | 791 |
| Lyndon B Johnson |
|
99.0 | 824.82 | -0.18 | 130,462 | 111,622 | 112,778 | 6,415 |
| Marble Falls |
|
94.3 | 736.29 | -0.71 | 7,167 | 7,167 | 7,597 | 599 |
| Travis |

|
73.8 | 664.13 | -16.87 | 827,372 | 810,340 | 1,098,044 | 15,069 |