East-Texas Climate Division Reservoirs: Monitored Water Supply Reservoirs are 86.0% full on 2026-04-01
Historical Data
| Date | Percent Full |
Reservoir Storage (acre-ft) |
Conservation Storage (acre-ft) |
Conservation Capacity (acre-ft) |
|
|---|---|---|---|---|---|
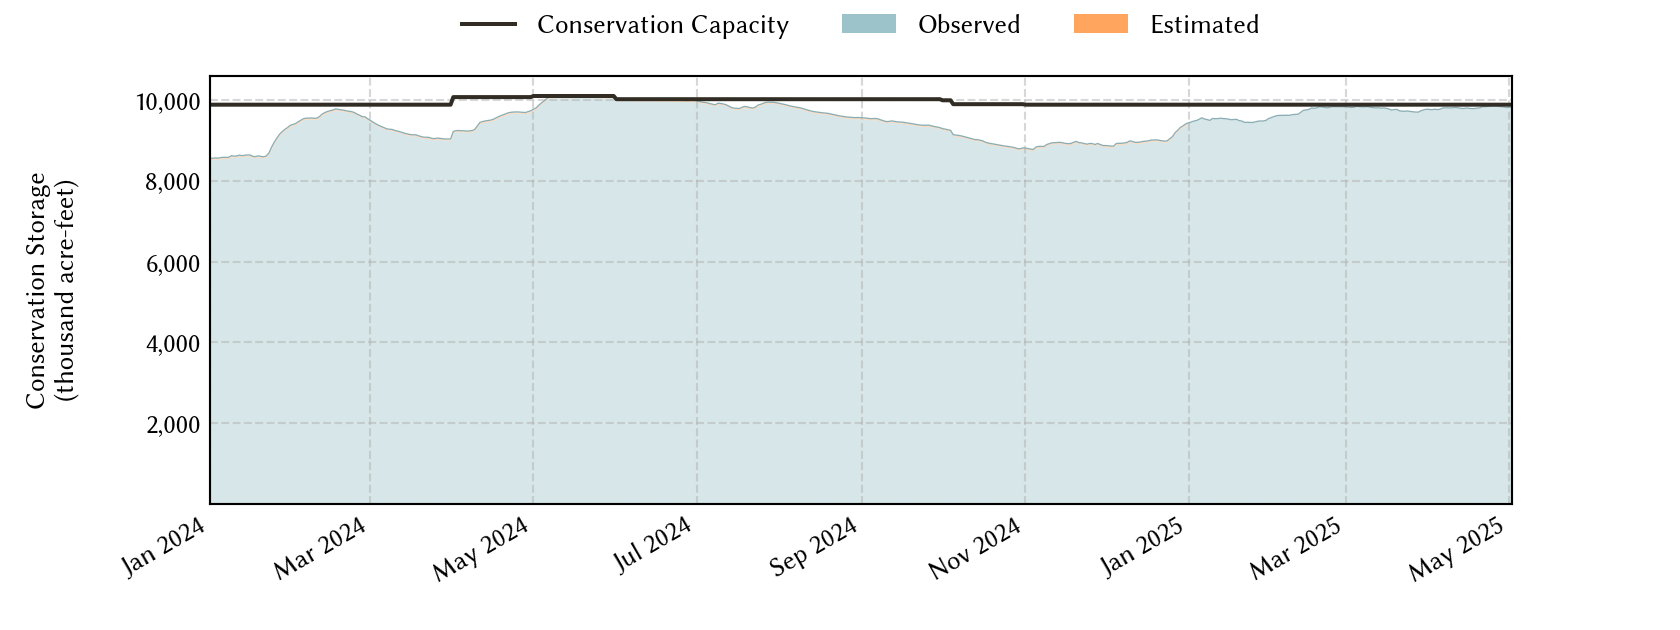
| Today | 2026-04-01 | 86.0 | 10,696,133 | 8,505,429 | 9,887,970 |
| Yesterday | 2026-03-31 | 86.0 | 10,697,802 | 8,506,588 | 9,887,970 |
| 2 days ago | 2026-03-30 | 86.1 | 10,706,370 | 8,510,951 | 9,887,970 |
| 1 week ago | 2026-03-25 | 86.3 | 10,767,242 | 8,533,113 | 9,887,970 |
| 1 month ago | 2026-03-01 | 84.7 | 10,555,079 | 8,376,038 | 9,887,970 |
| 3 months ago | 2026-01-01 | 84.4 | 10,509,460 | 8,346,860 | 9,887,970 |
| 6 months ago | 2025-10-01 | 86.9 | 10,802,242 | 8,589,929 | 9,887,970 |
| 1 year ago | 2025-04-01 | 98.8 | 12,321,501 | 9,770,010 | 9,887,970 |
*
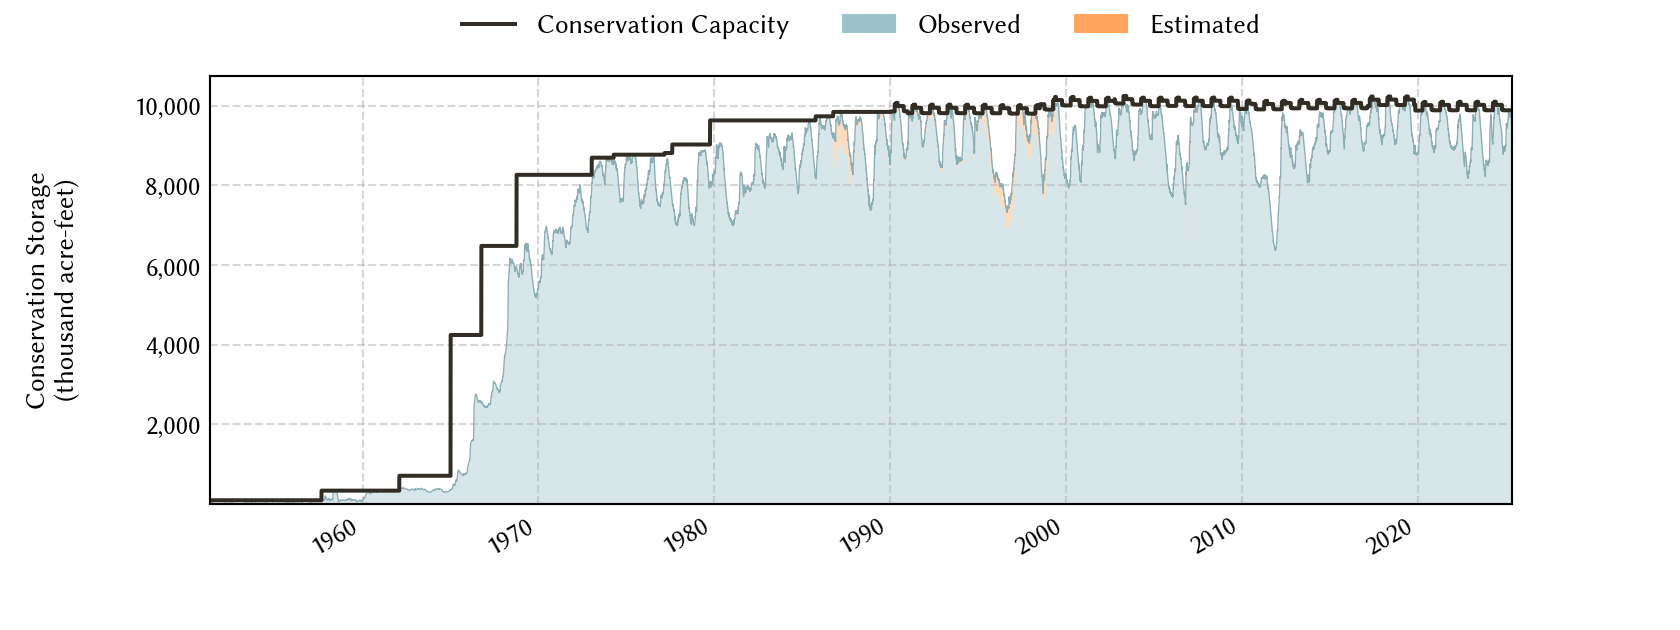
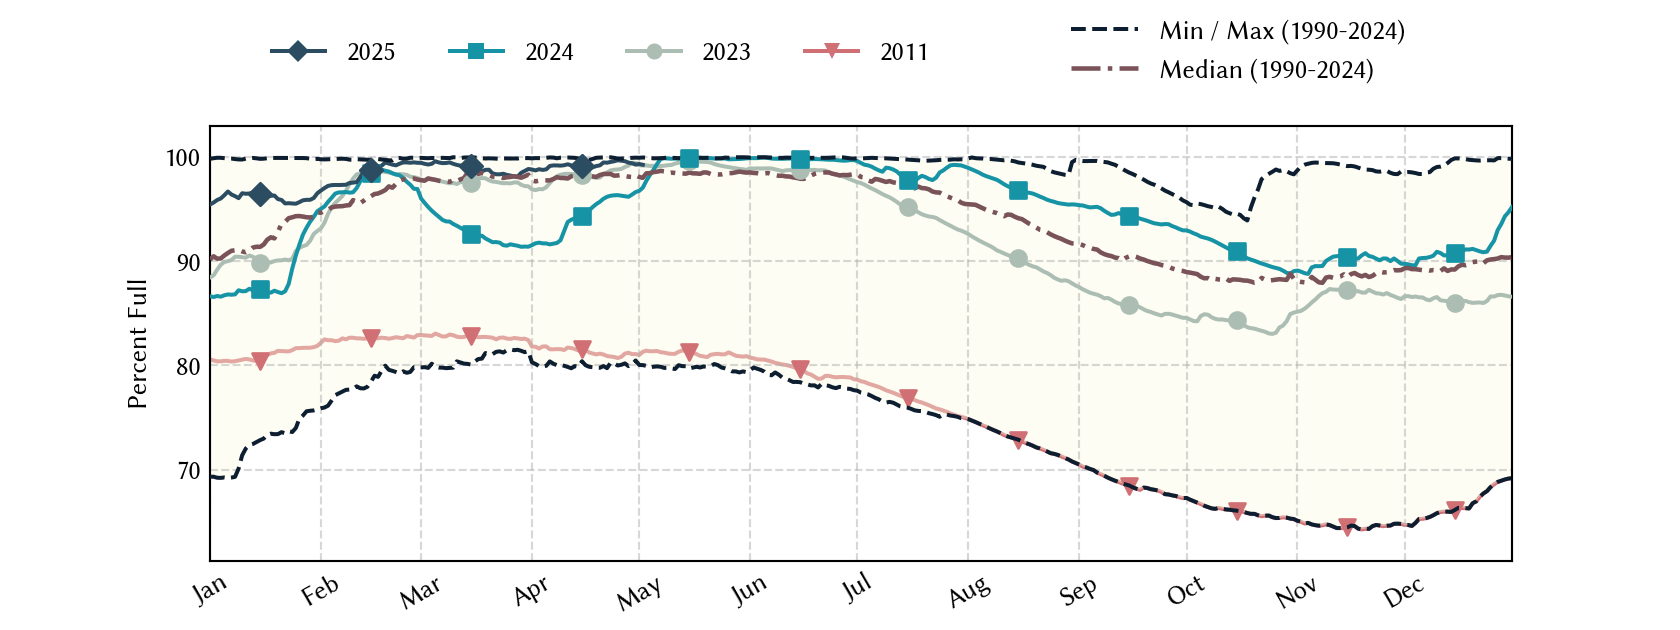
Percent Full is based on Conservation Storage and Conservation Capacity and doesn't account for storage in flood pool.
Area Map
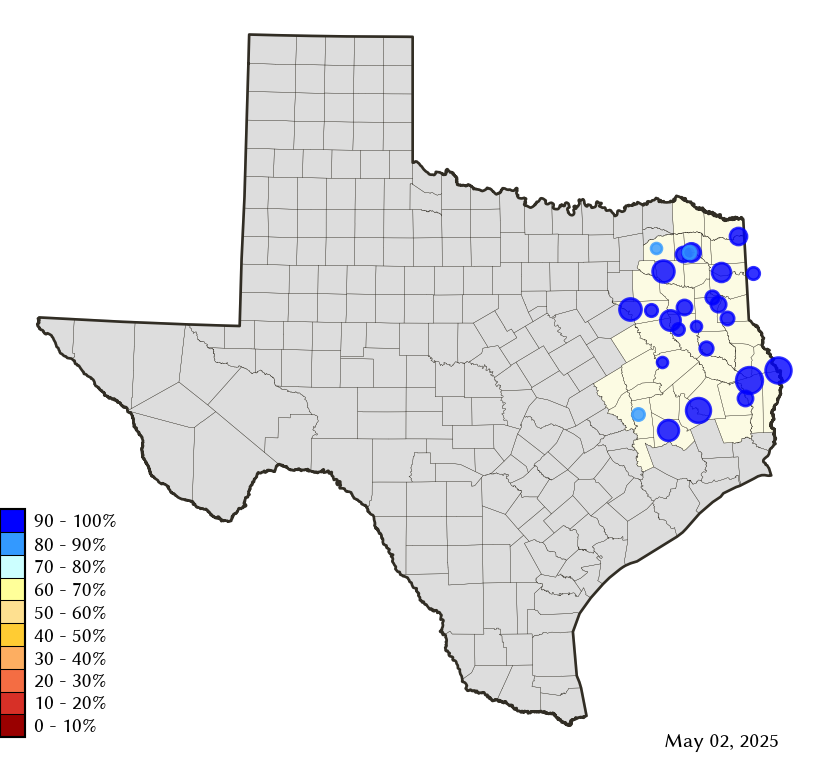
Reservoir Storage
| Reservoir | Type | Percent Full |
Water Level (ft) |
Height Above Conservation Pool (ft) |
Reservoir Storage (acre-ft) |
Conservation Storage (acre-ft) |
Conservation Capacity (acre-ft) |
Surface Area (acres) |
|---|---|---|---|---|---|---|---|---|
| Athens |

|
100.0 | 440.15 | 0.15 | 29,823 | 29,503 | 29,503 | - n.a. - |
| B A Steinhagen |
|
93.5 | 82.55 | -0.45 | 64,748 | 64,675 | 69,186 | 9,821 |
| Bob Sandlin |
|
93.9 | 336.17 | -1.33 | 191,499 | 180,768 | 192,417 | 8,628 |
| Caddo 1 |
|
100.0 | 168.93 | 0.43 | 138,546 | 29,898 | 29,898 | 27,670 |
| Cedar Creek |
|
84.0 | 318.67 | -3.33 | 541,420 | 541,321 | 644,686 | 29,558 |
| Cherokee |
|
100.0 | 280.21 | 0.21 | 45,679 | 40,094 | 40,094 | - n.a. - |
| Conroe |
|
94.2 | 199.77 | -1.23 | 393,544 | 393,517 | 417,577 | 19,229 |
| Cypress Springs |
|
96.7 | 377.31 | -0.69 | 64,543 | 64,543 | 66,756 | 3,182 |
| Fork |
|
87.2 | 399.96 | -3.04 | 559,986 | 528,543 | 606,088 | 24,142 |
| Gibbons Creek |
|
96.6 | 246.66 | -0.34 | 26,563 | 24,859 | 25,721 | 2,516 |
| Houston County |
|
100.0 | 260.07 | 0.07 | 17,756 | 17,113 | 17,113 | - n.a. - |
| Jacksonville |
|
100.0 | 422.05 | 0.05 | 25,790 | 25,670 | 25,670 | - n.a. - |
| Lake O' the Pines |

|
95.0 | 227.80 | -0.70 | 229,186 | 229,186 | 241,363 | 17,157 |
| Livingston |
|
99.7 | 130.94 | -0.06 | 1,598,847 | 1,598,847 | 1,603,504 | 77,491 |
| Martin |
|
89.3 | 304.32 | -1.68 | 67,660 | 67,660 | 75,726 | 4,648 |
| Monticello |
|
78.6 | 336.00 | -4.00 | 27,296 | 27,296 | 34,740 | 1,639 |
| Murvaul |
|
99.6 | 265.25 | -0.05 | 38,113 | 38,113 | 38,285 | 3,464 |
| Nacogdoches |
|
97.0 | 278.46 | -0.54 | 38,357 | 38,355 | 39,522 | 2,133 |
| Palestine |
|
99.1 | 344.85 | -0.15 | 363,856 | 363,847 | 367,303 | 22,978 |
| Sam Rayburn |
|
70.5 | 156.13 | -8.27 | 2,034,030 | 2,015,074 | 2,857,077 | 89,230 |
| Striker |
|
96.1 | 292.66 | -0.34 | 21,139 | 16,217 | 16,878 | 1,929 |
| Sulphur Springs |
|
79.0 | 456.77 | -2.18 | 14,028 | 14,028 | 17,747 | - n.a. - |
| Toledo Bend 2 |
|
87.8 | 168.69 | -3.31 | 3,932,490 | 1,964,195 | 2,236,450 | 166,632 |
| Tyler |
|
96.4 | 374.83 | -0.55 | 74,725 | 69,514 | 72,073 | 4,591 |
| Wright Patman |
|
100.0 | 222.15 | 1.55 | 156,509 | 122,593 | 122,593 | 23,530 |
footnotes
1
Caddo Lake straddles the border of Texas and Louisiana, Texas has rights to 50% of Lake Caddo's total conservation capacity. Percent full, conservation storage and conservation capacity are based on the Texas share.
2
Toledo Bend Reservoir straddles the border of Texas and Louisiana, Texas has rights to 50% of Toledo Bend Reservoir's total conservation capacity. Percent full, conservation storage and conservation capacity are based on the Texas share.