Austin Area Reservoirs: Monitored Water Supply Reservoirs are 83.6% full on 2026-04-01
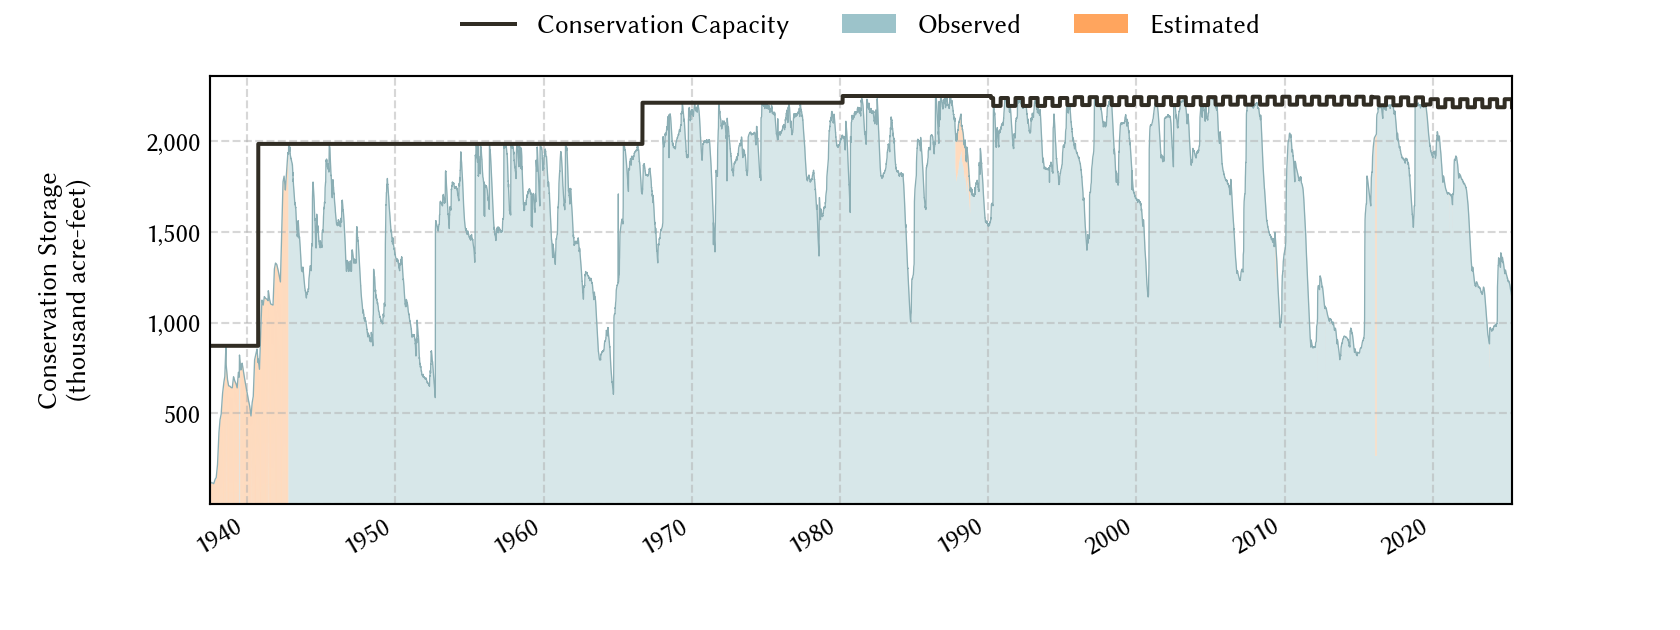
Historical Data
| Date | Percent Full |
Reservoir Storage (acre-ft) |
Conservation Storage (acre-ft) |
Conservation Capacity (acre-ft) |
|
|---|---|---|---|---|---|
| Today | 2026-04-01 | 83.6 | 1,897,672 | 1,866,829 | 2,232,539 |
| Yesterday | 2026-03-31 | 83.7 | 1,899,997 | 1,869,154 | 2,232,539 |
| 2 days ago | 2026-03-30 | 83.8 | 1,902,022 | 1,871,179 | 2,232,539 |
| 1 week ago | 2026-03-25 | 84.3 | 1,913,529 | 1,882,686 | 2,232,539 |
| 1 month ago | 2026-03-01 | 85.0 | 1,928,540 | 1,897,697 | 2,232,539 |
| 3 months ago | 2026-01-01 | 87.0 | 1,973,656 | 1,942,813 | 2,232,539 |
| 6 months ago | 2025-10-01 | 90.2 | 2,044,541 | 2,013,698 | 2,232,539 |
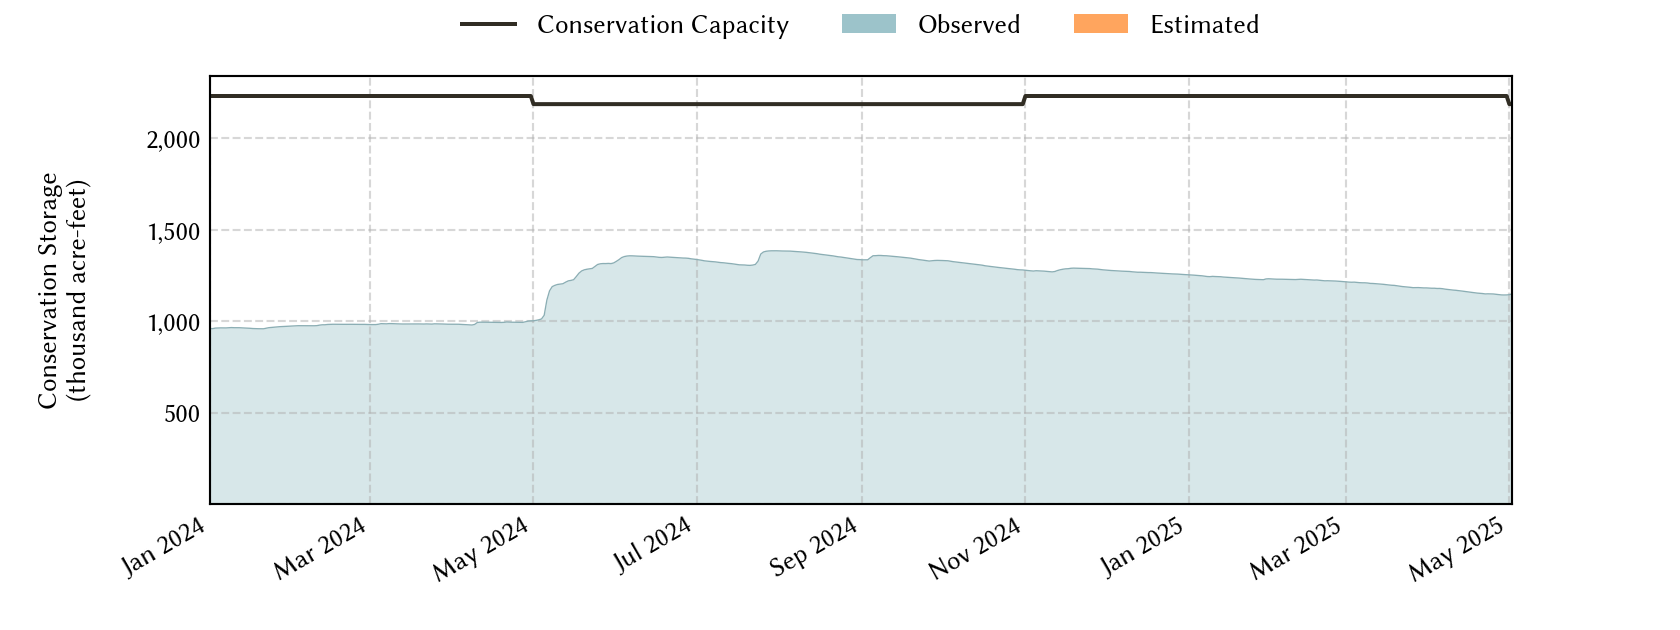
| 1 year ago | 2025-04-01 | 52.9 | 1,212,148 | 1,181,305 | 2,232,539 |
*
Percent Full is based on Conservation Storage and Conservation Capacity and doesn't account for storage in flood pool.
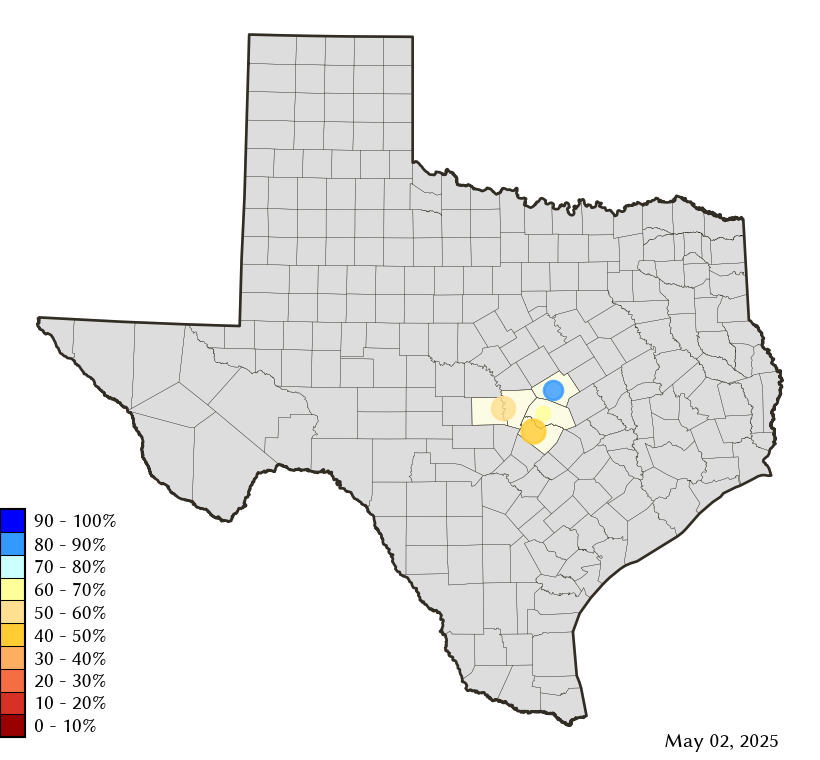
Area Map
Reservoir Storage
| Reservoir | Type | Percent Full |
Water Level (ft) |
Height Above Conservation Pool (ft) |
Reservoir Storage (acre-ft) |
Conservation Storage (acre-ft) |
Conservation Capacity (acre-ft) |
Surface Area (acres) |
|---|---|---|---|---|---|---|---|---|
| Buchanan |

|
94.0 | 1,017.65 | -2.35 | 828,160 | 814,498 | 866,694 | 21,996 |
| Georgetown |

|
75.8 | 783.37 | -7.63 | 28,871 | 28,808 | 38,005 | 1,106 |
| Stillhouse Hollow |
|
92.8 | 619.34 | -2.66 | 213,269 | 213,183 | 229,796 | 6,068 |
| Travis |
|
73.8 | 664.13 | -16.87 | 827,372 | 810,340 | 1,098,044 | 15,069 |