Coastal-Bend Planning Region Reservoirs: Monitored Water Supply Reservoirs are 8.0% full on 2026-04-01
Historical Data
| Date | Percent Full |
Reservoir Storage (acre-ft) |
Conservation Storage (acre-ft) |
Conservation Capacity (acre-ft) |
|
|---|---|---|---|---|---|
| Today | 2026-04-01 | 8.0 | 73,664 | 73,385 | 918,882 |
| Yesterday | 2026-03-31 | 8.0 | 73,813 | 73,534 | 918,882 |
| 2 days ago | 2026-03-30 | 8.0 | 74,068 | 73,789 | 918,882 |
| 1 week ago | 2026-03-25 | 8.2 | 75,452 | 75,173 | 918,882 |
| 1 month ago | 2026-03-01 | 8.9 | 81,651 | 81,372 | 918,882 |
| 3 months ago | 2026-01-01 | 10.2 | 94,133 | 93,854 | 918,882 |
| 6 months ago | 2025-10-01 | 12.4 | 114,607 | 114,328 | 918,882 |
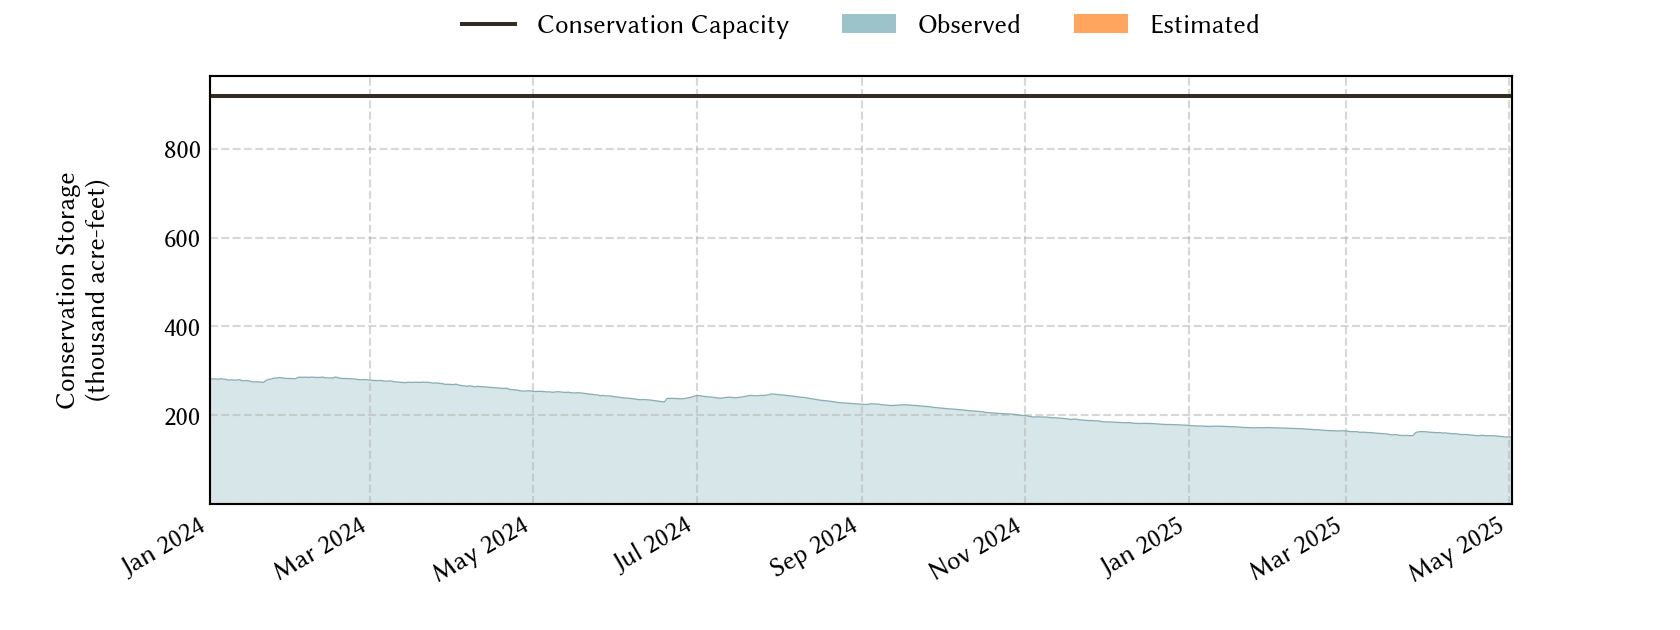
| 1 year ago | 2025-04-01 | 17.6 | 162,050 | 161,771 | 918,882 |
*
Percent Full is based on Conservation Storage and Conservation Capacity and doesn't account for storage in flood pool.
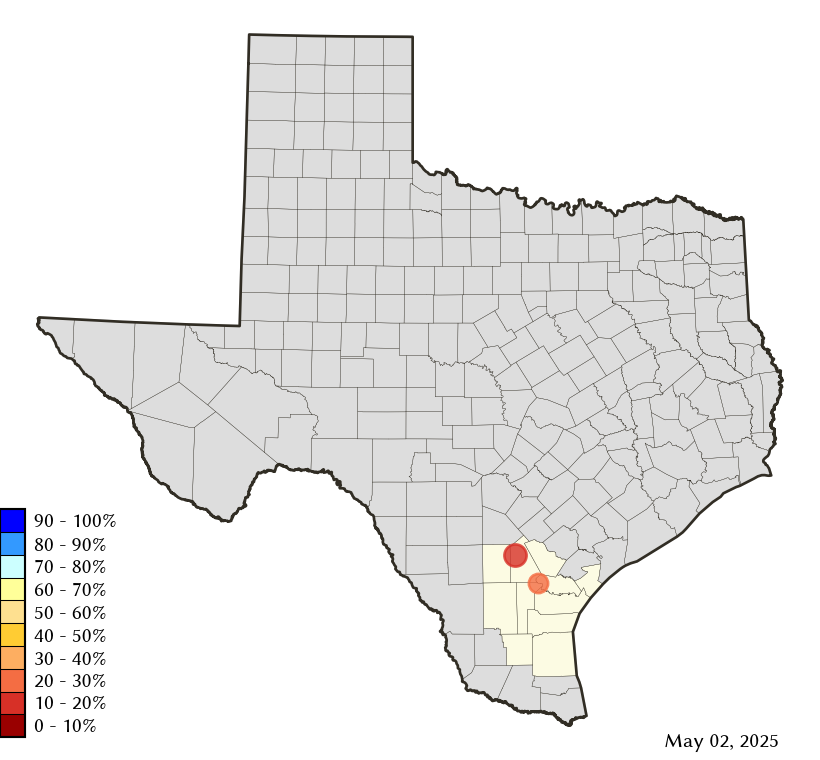
Area Map
Reservoir Storage
| Reservoir | Type | Percent Full |
Water Level (ft) |
Height Above Conservation Pool (ft) |
Reservoir Storage (acre-ft) |
Conservation Storage (acre-ft) |
Conservation Capacity (acre-ft) |
Surface Area (acres) |
|---|---|---|---|---|---|---|---|---|
| Choke Canyon |

|
7.7 | 178.97 | -41.53 | 51,077 | 51,076 | 662,820 | 5,298 |
| Corpus Christi |
|
8.7 | 74.93 | -19.07 | 22,587 | 22,309 | 256,062 | 4,774 |