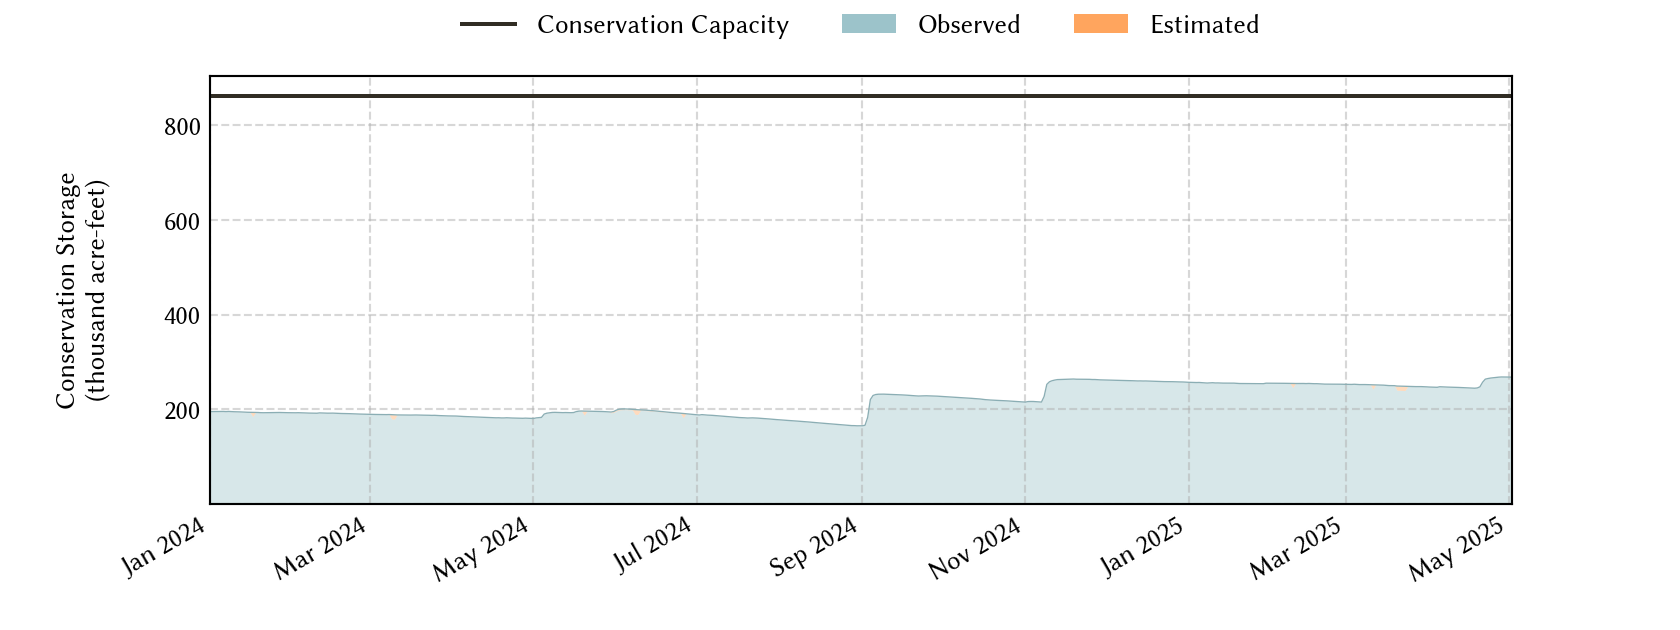
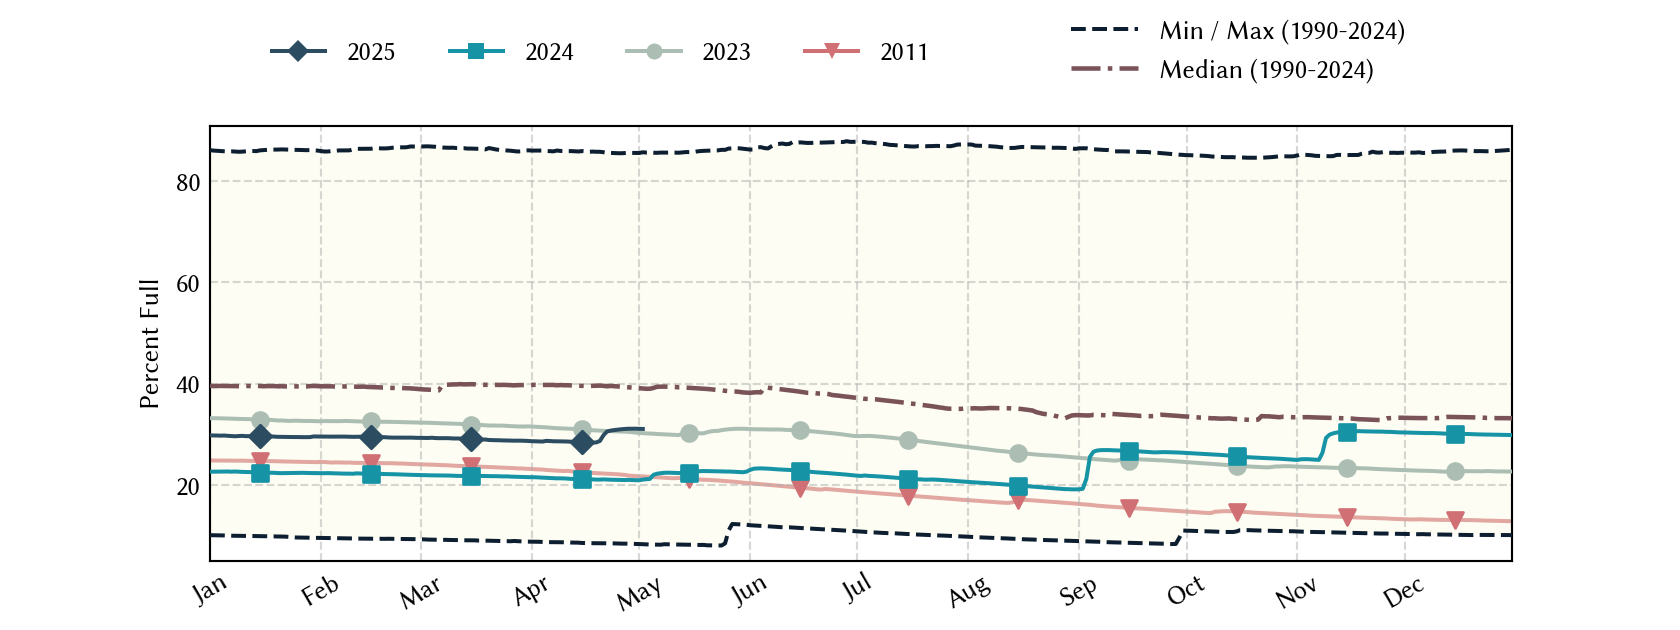
San Angelo Area Reservoirs: Monitored Water Supply Reservoirs are 34.0% full on 2026-04-01
Historical Data
| Date | Percent Full |
Reservoir Storage (acre-ft) |
Conservation Storage (acre-ft) |
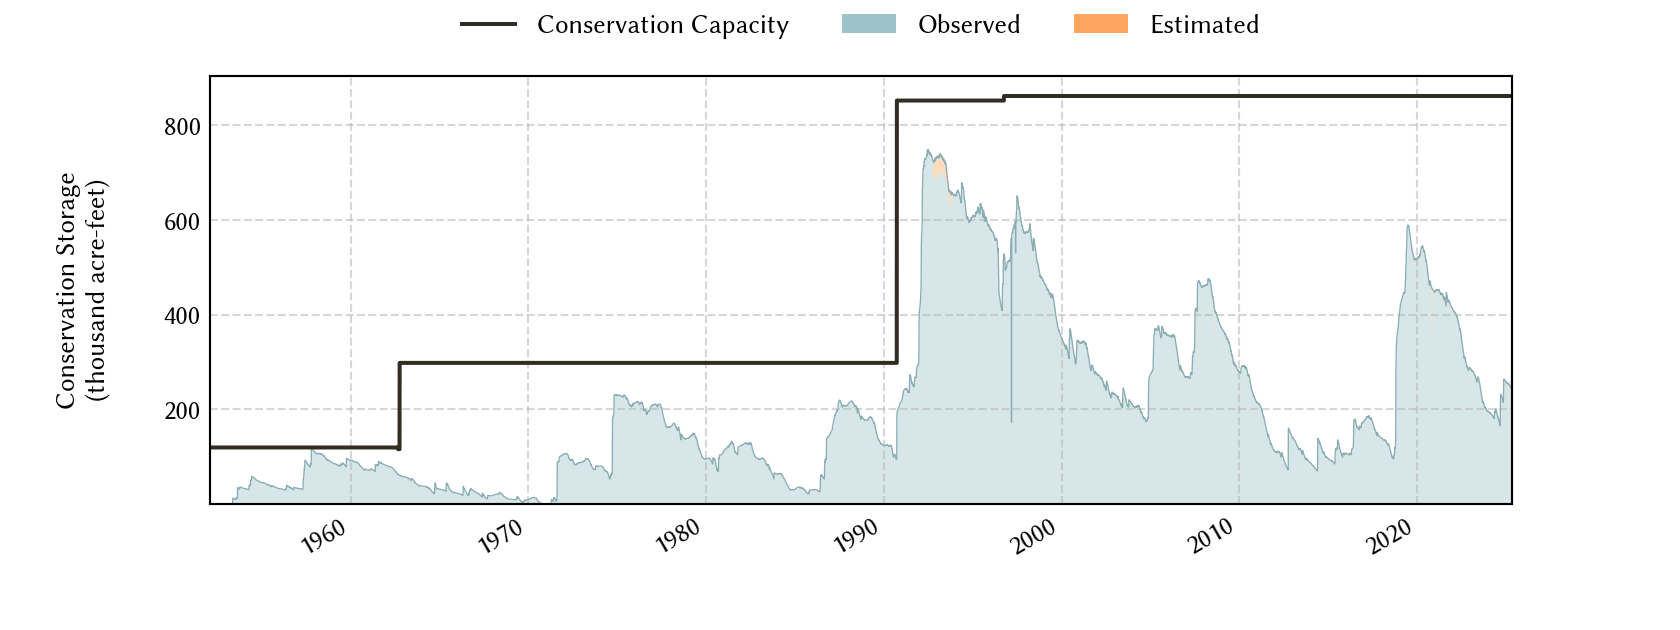
Conservation Capacity (acre-ft) |
|
|---|---|---|---|---|---|
| Today | 2026-04-01 | 34.0 | 297,789 | 293,546 | 862,151 |
| Yesterday | 2026-03-31 | 34.1 | 298,077 | 293,834 | 862,151 |
| 2 days ago | 2026-03-30 | 34.1 | 298,296 | 294,053 | 862,151 |
| 1 week ago | 2026-03-25 | 34.2 | 299,513 | 295,270 | 862,151 |
| 1 month ago | 2026-03-01 | 34.7 | 303,347 | 299,104 | 862,151 |
| 3 months ago | 2026-01-01 | 35.9 | 313,603 | 309,360 | 862,151 |
| 6 months ago | 2025-10-01 | 37.9 | 331,189 | 326,946 | 862,151 |
| 1 year ago | 2025-04-01 | 28.6 | 250,765 | 246,522 | 862,151 |
*
Percent Full is based on Conservation Storage and Conservation Capacity and doesn't account for storage in flood pool.
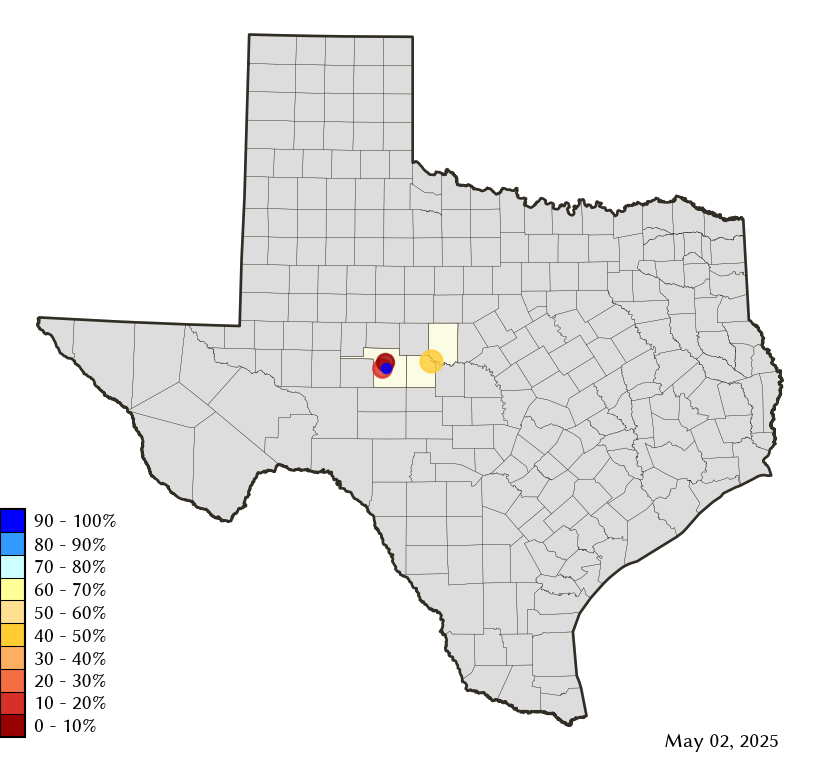
Area Map
Reservoir Storage
| Reservoir | Type | Percent Full |
Water Level (ft) |
Height Above Conservation Pool (ft) |
Reservoir Storage (acre-ft) |
Conservation Storage (acre-ft) |
Conservation Capacity (acre-ft) |
Surface Area (acres) |
|---|---|---|---|---|---|---|---|---|
| Nasworthy |

|
86.0 | 1,871.76 | -0.95 | 8,762 | 8,269 | 9,615 | 1,236 |
| O C Fisher |

|
14.2 | 1,875.43 | -32.57 | 16,396 | 16,395 | 115,742 | 1,326 |
| O H Ivie |
|
45.1 | 1,531.19 | -20.31 | 249,731 | 249,731 | 554,340 | - n.a. - |
| Twin Buttes |
|
10.5 | 1,903.13 | -37.07 | 22,900 | 19,151 | 182,454 | 1,580 |