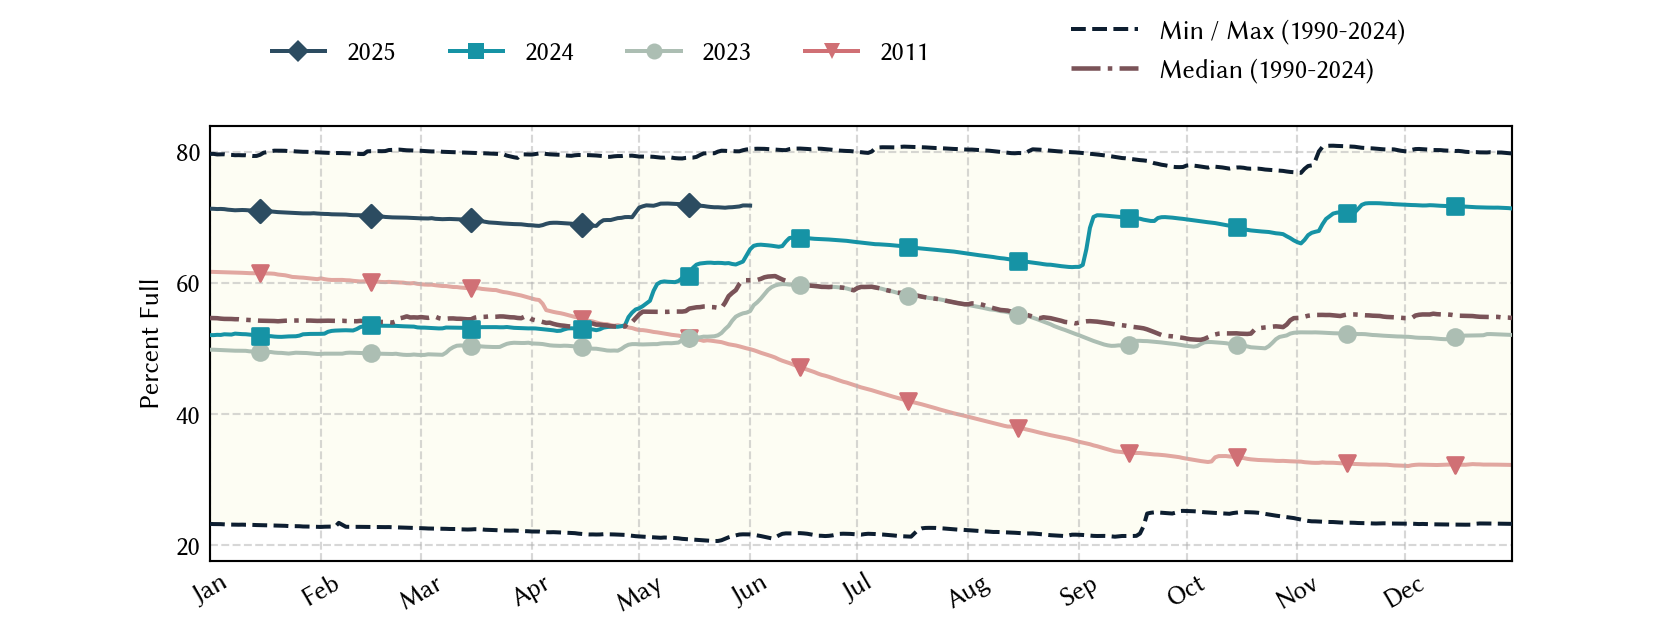
Low-Rolling-Plains Climate Division Reservoirs: Monitored Water Supply Reservoirs are 61.3% full on 2026-04-01
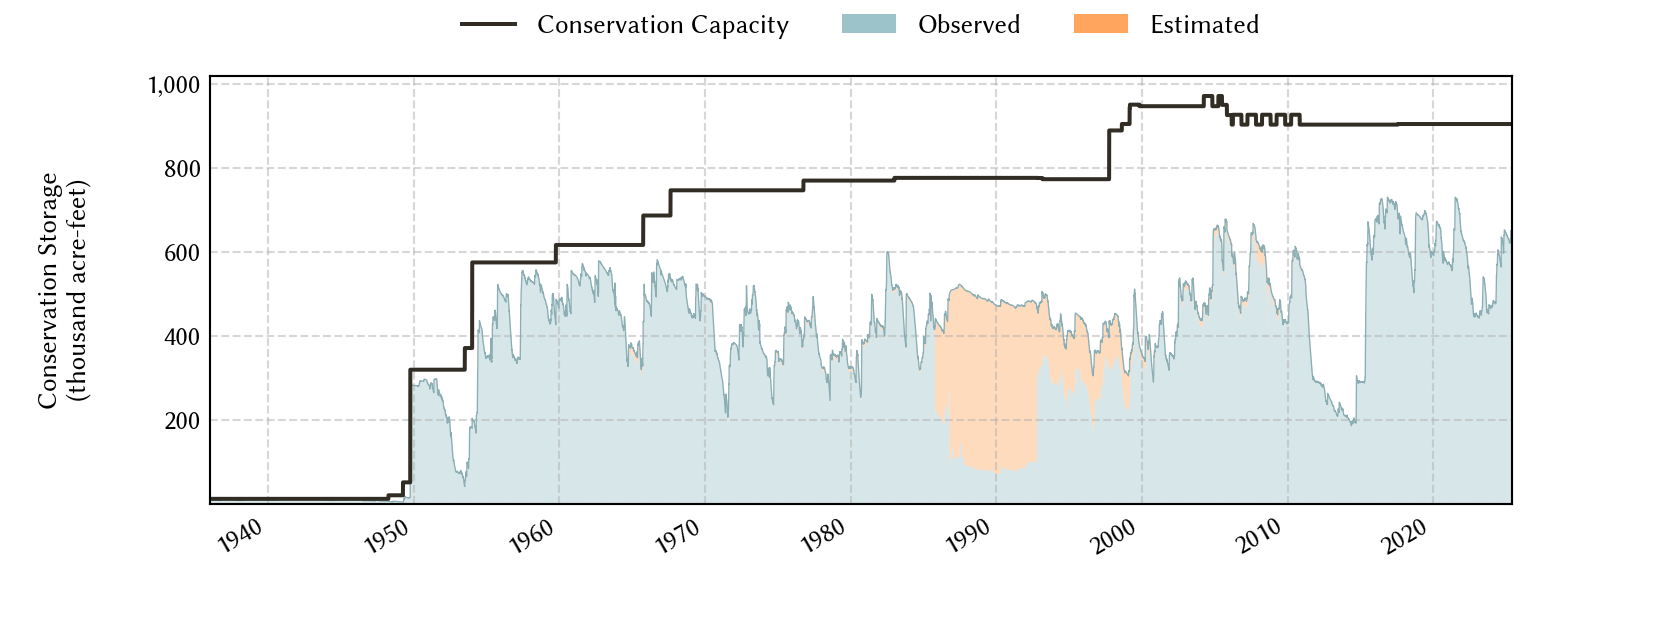
Historical Data
| Date | Percent Full |
Reservoir Storage (acre-ft) |
Conservation Storage (acre-ft) |
Conservation Capacity (acre-ft) |
|
|---|---|---|---|---|---|
| Today | 2026-04-01 | 61.3 | 557,067 | 554,523 | 903,870 |
| Yesterday | 2026-03-31 | 61.5 | 558,422 | 555,878 | 903,870 |
| 2 days ago | 2026-03-30 | 61.7 | 560,648 | 558,104 | 903,870 |
| 1 week ago | 2026-03-25 | 63.0 | 572,174 | 569,630 | 903,870 |
| 1 month ago | 2026-03-01 | 64.1 | 582,191 | 579,647 | 903,870 |
| 3 months ago | 2026-01-01 | 65.3 | 592,686 | 590,142 | 903,870 |
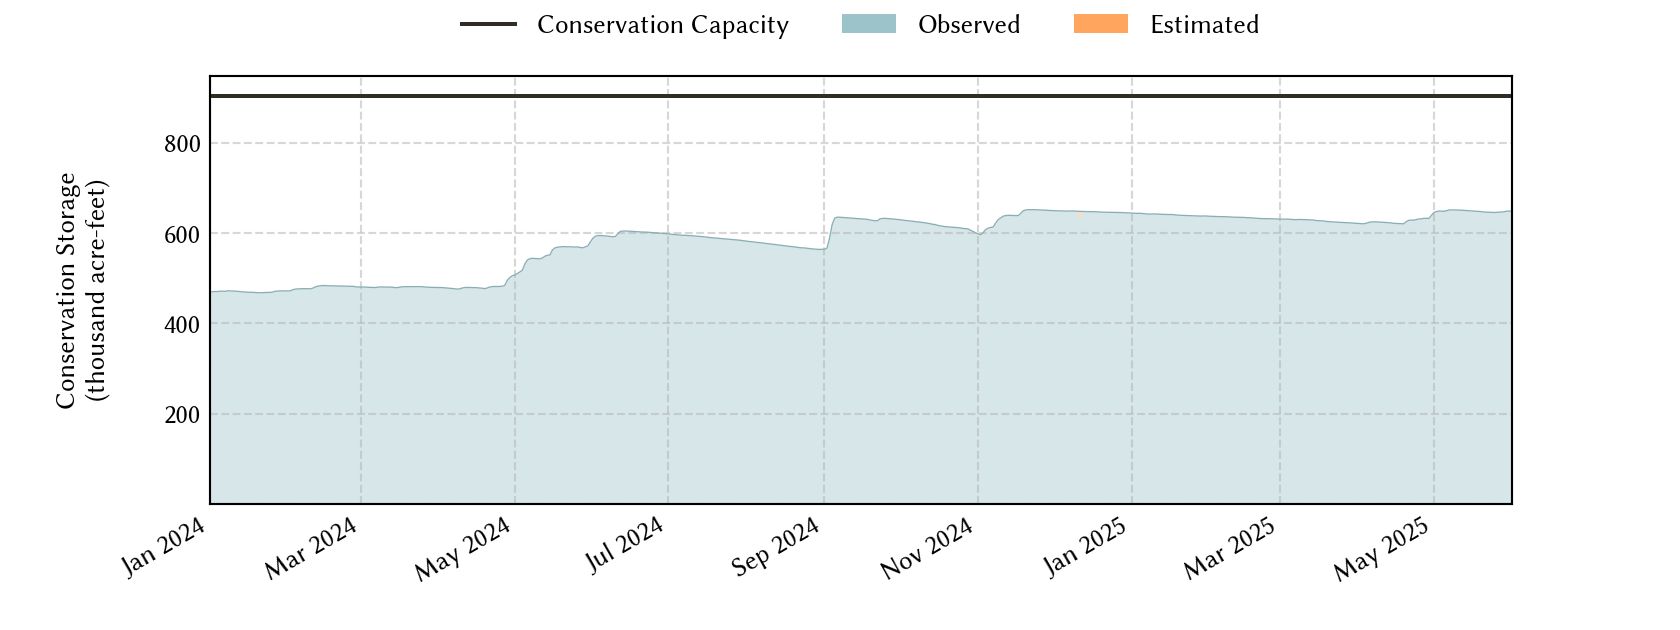
| 6 months ago | 2025-10-01 | 68.9 | 633,006 | 623,060 | 903,870 |
| 1 year ago | 2025-04-01 | 68.8 | 627,553 | 621,630 | 903,870 |
*
Percent Full is based on Conservation Storage and Conservation Capacity and doesn't account for storage in flood pool.
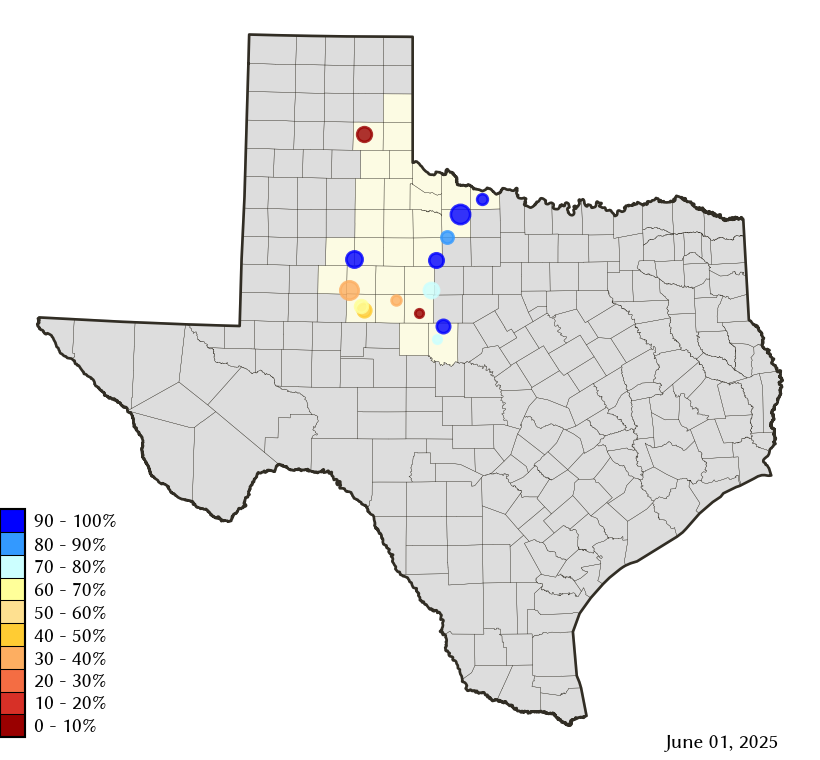
Area Map
Reservoir Storage
| Reservoir | Type | Percent Full |
Water Level (ft) |
Height Above Conservation Pool (ft) |
Reservoir Storage (acre-ft) |
Conservation Storage (acre-ft) |
Conservation Capacity (acre-ft) |
Surface Area (acres) |
|---|---|---|---|---|---|---|---|---|
| Abilene |

|
3.6 | 1,988.44 | -23.86 | 285 | 285 | 7,900 | 91 |
| Alan Henry |
|
82.8 | 2,213.59 | -6.41 | 79,701 | 79,701 | 96,207 | 2,366 |
| Champion Creek |
|
40.1 | 2,061.44 | -21.56 | 16,659 | 16,659 | 41,580 | 834 |
| Coleman |
|
82.7 | 1,713.74 | -3.76 | 31,515 | 31,497 | 38,075 | 1,680 |
| Colorado City |
|
53.3 | 2,058.84 | -11.36 | 16,383 | 16,383 | 30,758 | - n.a. - |
| Fort Phantom Hill |
|
71.4 | 1,630.15 | -5.75 | 50,024 | 50,018 | 70,030 | 3,090 |
| Greenbelt |
|
7.2 | 2,611.90 | -52.10 | 4,779 | 4,347 | 59,968 | 356 |
| Hords Creek |

|
54.6 | 1,890.89 | -9.11 | 4,428 | 4,425 | 8,109 | 314 |
| J B Thomas |
|
27.4 | 2,230.52 | -27.48 | 55,412 | 54,739 | 199,931 | 3,555 |
| Kemp |
|
91.0 | 1,142.53 | -1.47 | 223,466 | 223,340 | 245,307 | 14,565 |
| Millers Creek |
|
67.9 | 1,329.47 | -4.53 | 19,456 | 18,173 | 26,768 | 1,556 |
| North Fork Buffalo Creek |
|
78.5 | 1,045.88 | -2.12 | 12,083 | 12,083 | 15,400 | 1,285 |
| Stamford |
|
77.6 | 1,414.57 | -2.23 | 40,009 | 40,006 | 51,570 | 4,257 |
| Sweetwater |
|
23.4 | 2,094.22 | -22.28 | 2,867 | 2,867 | 12,267 | 247 |