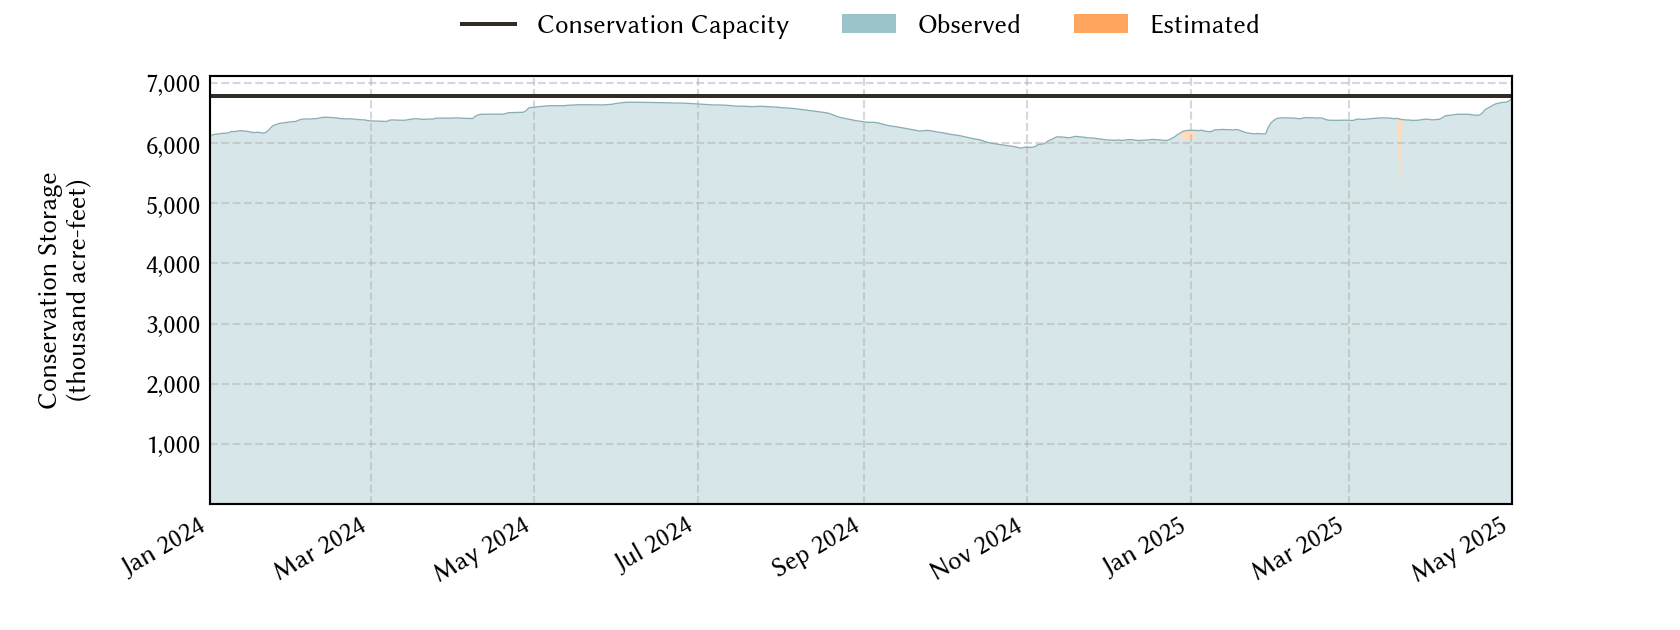
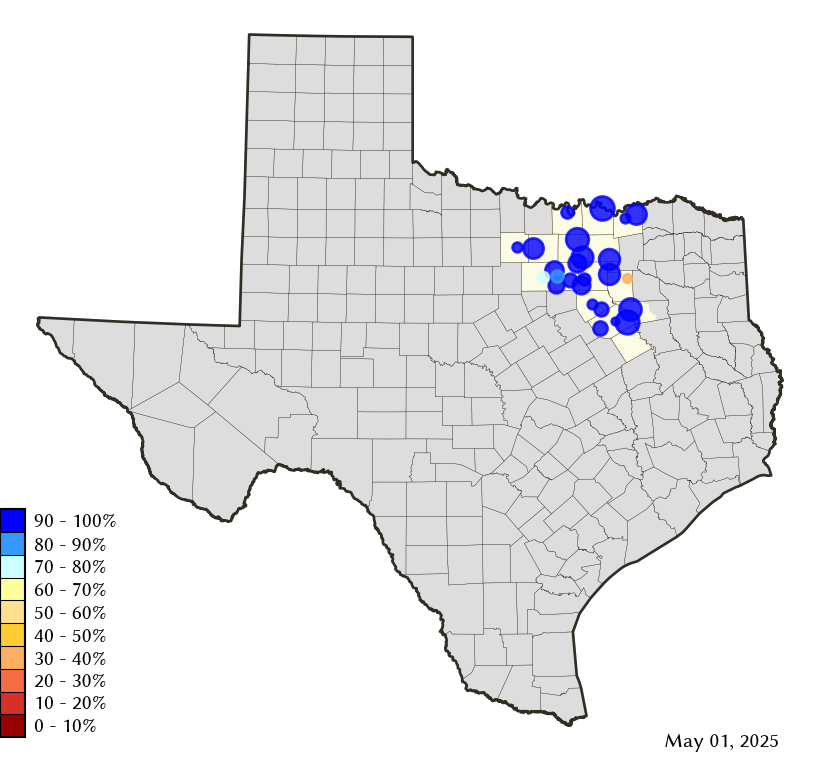
Region-C Planning Region Reservoirs: Monitored Water Supply Reservoirs are 94.3% full on 2026-04-01
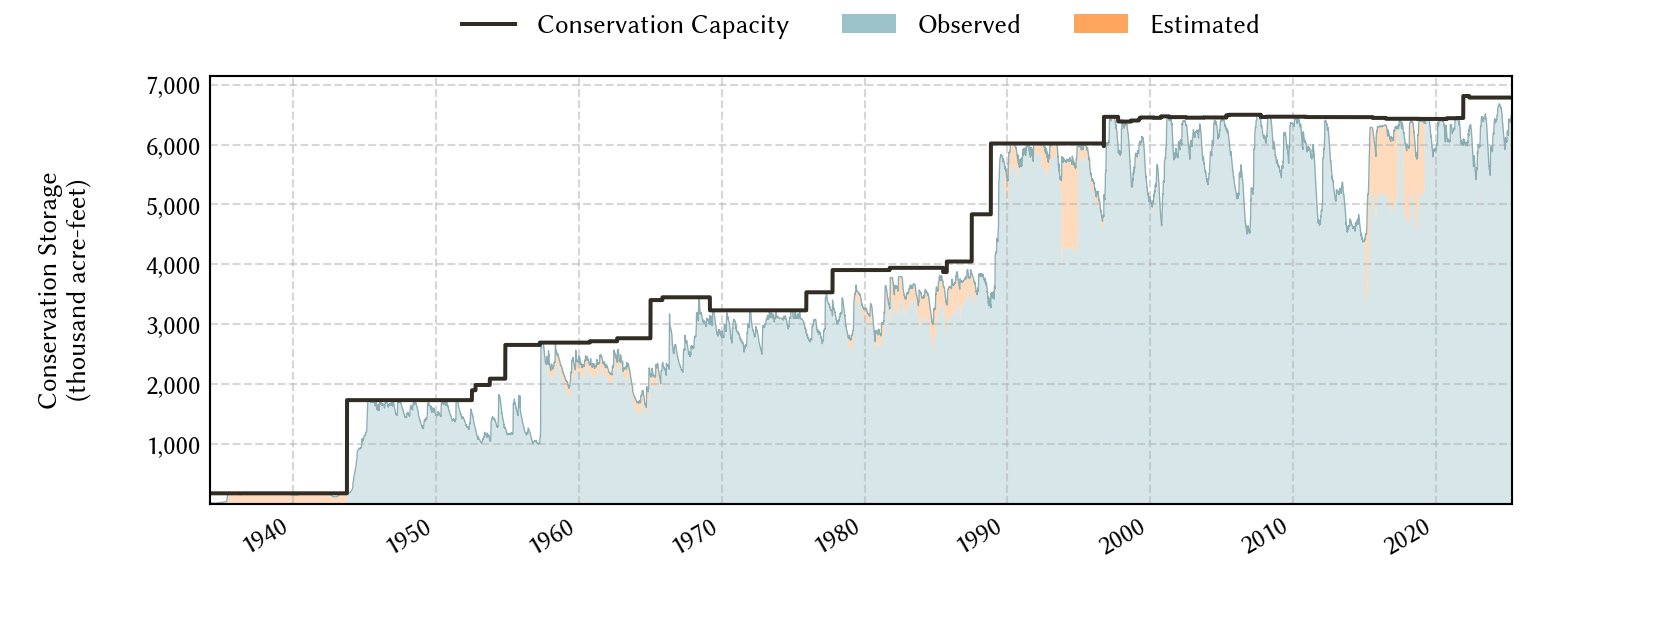
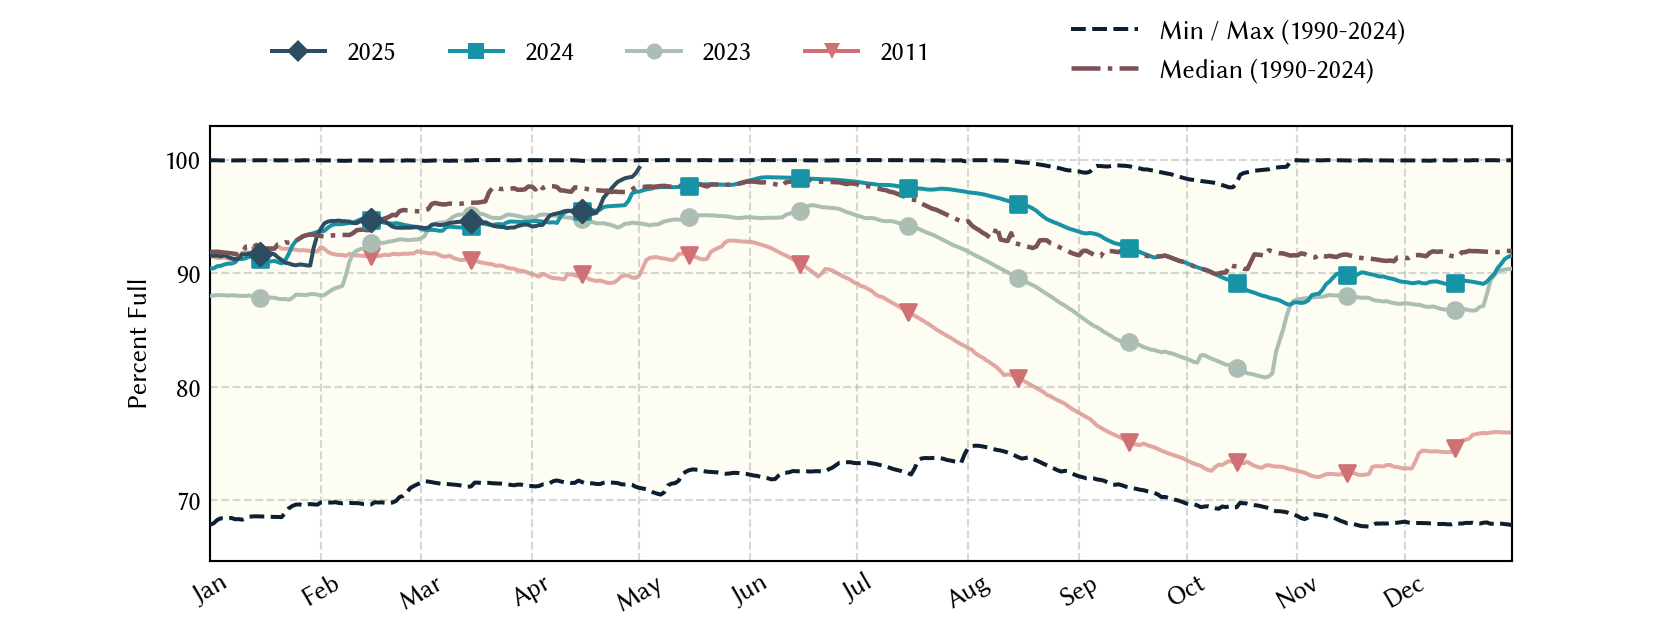
Historical Data
| Date | Percent Full |
Reservoir Storage (acre-ft) |
Conservation Storage (acre-ft) |
Conservation Capacity (acre-ft) |
|
|---|---|---|---|---|---|
| Today | 2026-04-01 | 94.3 | 7,708,712 | 6,395,728 | 6,783,467 |
| Yesterday | 2026-03-31 | 94.3 | 7,709,233 | 6,396,620 | 6,783,467 |
| 2 days ago | 2026-03-30 | 94.3 | 7,712,212 | 6,399,803 | 6,783,467 |
| 1 week ago | 2026-03-25 | 94.5 | 7,731,244 | 6,412,993 | 6,783,467 |
| 1 month ago | 2026-03-01 | 93.8 | 7,689,601 | 6,364,806 | 6,783,467 |
| 3 months ago | 2026-01-01 | 93.1 | 7,629,745 | 6,313,811 | 6,783,467 |
| 6 months ago | 2025-10-01 | 94.6 | 7,728,382 | 6,418,062 | 6,783,467 |
| 1 year ago | 2025-04-01 | 94.2 | 7,617,339 | 6,386,679 | 6,783,467 |
*
Percent Full is based on Conservation Storage and Conservation Capacity and doesn't account for storage in flood pool.
Area Map
Reservoir Storage
| Reservoir | Type | Percent Full |
Water Level (ft) |
Height Above Conservation Pool (ft) |
Reservoir Storage (acre-ft) |
Conservation Storage (acre-ft) |
Conservation Capacity (acre-ft) |
Surface Area (acres) |
|---|---|---|---|---|---|---|---|---|
| Arlington |

|
94.2 | 548.77 | -1.23 | 37,843 | 37,811 | 40,157 | 1,892 |
| Bardwell |

|
100.0 | 421.34 | 0.34 | 45,047 | 43,856 | 43,856 | 3,338 |
| Benbrook |
|
82.5 | 689.67 | -4.33 | 70,700 | 70,700 | 85,648 | 3,239 |
| Bois d'Arc |
|
88.3 | 531.34 | -2.66 | 324,610 | 324,610 | 367,609 | 15,352 |
| Bonham |
|
74.9 | 562.20 | -2.80 | 8,274 | 8,262 | 11,027 | 916 |
| Bridgeport |
|
85.0 | 831.24 | -4.76 | 316,336 | 316,336 | 372,183 | 11,219 |
| Cedar Creek |
|
84.0 | 318.67 | -3.33 | 541,420 | 541,321 | 644,686 | 29,558 |
| Eagle Mountain |
|
82.5 | 645.36 | -3.74 | 152,683 | 152,683 | 185,087 | 8,150 |
| Grapevine |
|
100.0 | 535.09 | 0.09 | 163,658 | 163,064 | 163,064 | - n.a. - |
| Halbert |
|
75.1 | 365.25 | -2.75 | 4,532 | 4,532 | 6,033 | 514 |
| Hubert H Moss |
|
89.4 | 712.58 | -2.42 | 21,613 | 21,516 | 24,058 | 1,021 |
| Joe Pool |
|
100.0 | 522.17 | 0.17 | 152,140 | 149,629 | 149,629 | 6,738 |
| Lavon |
|
97.9 | 491.59 | -0.41 | 404,182 | 401,341 | 409,757 | 20,436 |
| Lewisville |
|
99.6 | 521.91 | -0.09 | 596,473 | 560,799 | 563,228 | 26,976 |
| Lost Creek |
|
93.3 | 1,007.47 | -2.03 | 11,144 | 11,144 | 11,950 | - n.a. - |
| Mountain Creek |
|
100.0 | 457.82 | 0.82 | 25,121 | 22,850 | 22,850 | 2,950 |
| Navarro Mills |
|
95.1 | 423.98 | -0.52 | 47,408 | 47,407 | 49,827 | 4,600 |
| New Terrell City |
|
26.8 | 494.00 | -10.00 | 2,307 | 2,296 | 8,583 | 378 |
| Ray Hubbard |
|
99.3 | 435.35 | -0.15 | 436,432 | 436,432 | 439,559 | 20,763 |
| Ray Roberts |
|
99.9 | 632.48 | -0.02 | 787,923 | 787,600 | 788,167 | 28,578 |
| Richland-Chambers |
|
92.8 | 313.16 | -1.84 | 1,045,825 | 1,020,042 | 1,099,417 | 42,403 |
| Texoma 1 |
|
99.0 | 616.68 | -0.32 | 2,463,771 | 1,231,885 | 1,243,801 | 74,868 |
| Waxahachie |
|
84.9 | 528.86 | -2.64 | 9,974 | 9,392 | 11,060 | 602 |
| Weatherford |
|
65.9 | 889.87 | -6.13 | 11,745 | 11,745 | 17,812 | 908 |
| Worth |
|
75.7 | 592.21 | -1.79 | 27,551 | 18,475 | 24,419 | 3,213 |
footnotes
1
Lake Texoma straddles the border of Texas and Oklahoma, Texas has rights to 50% of Lake Texoma's total conservation capacity. Percent full, conservation storage and conservation capacity are based on the Texas share.