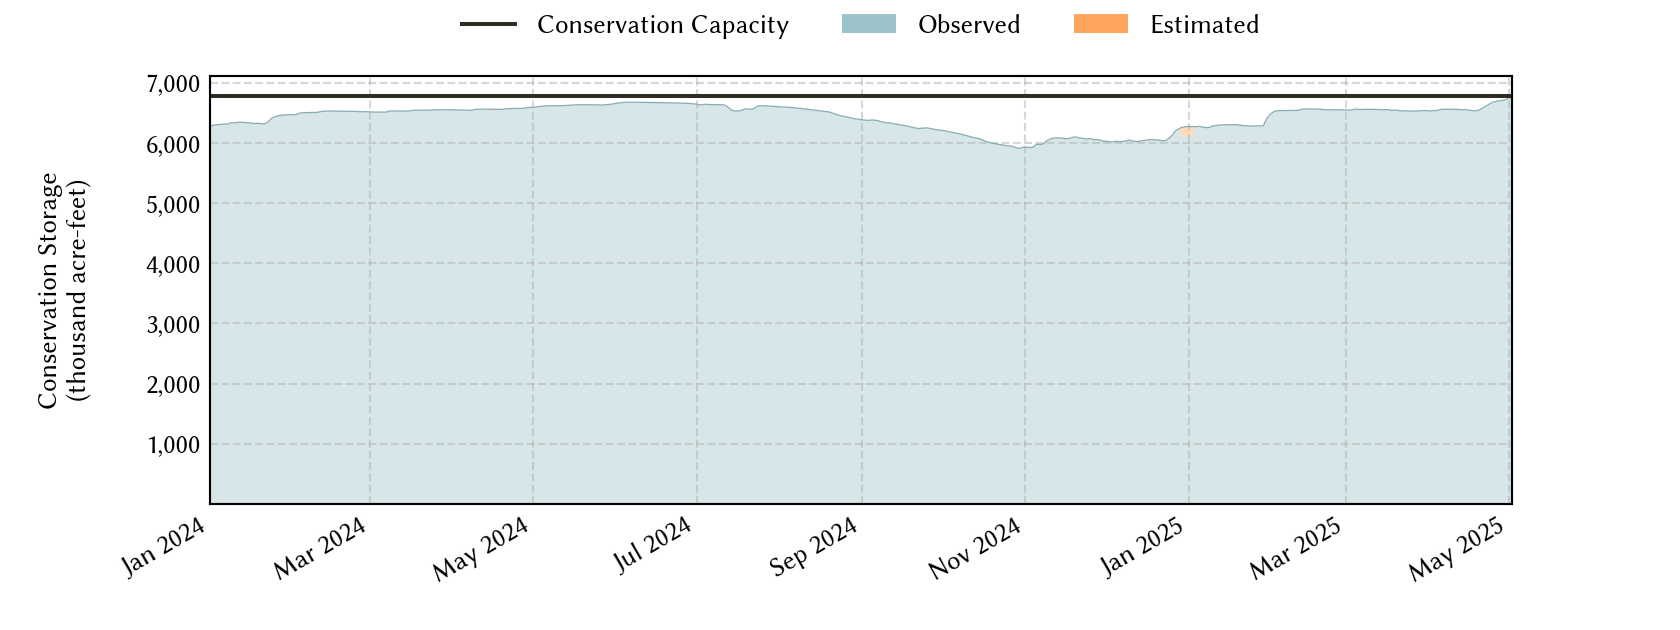
Trinity River Basin Reservoirs: Monitored Water Supply Reservoirs are 95.1% full on 2026-04-01
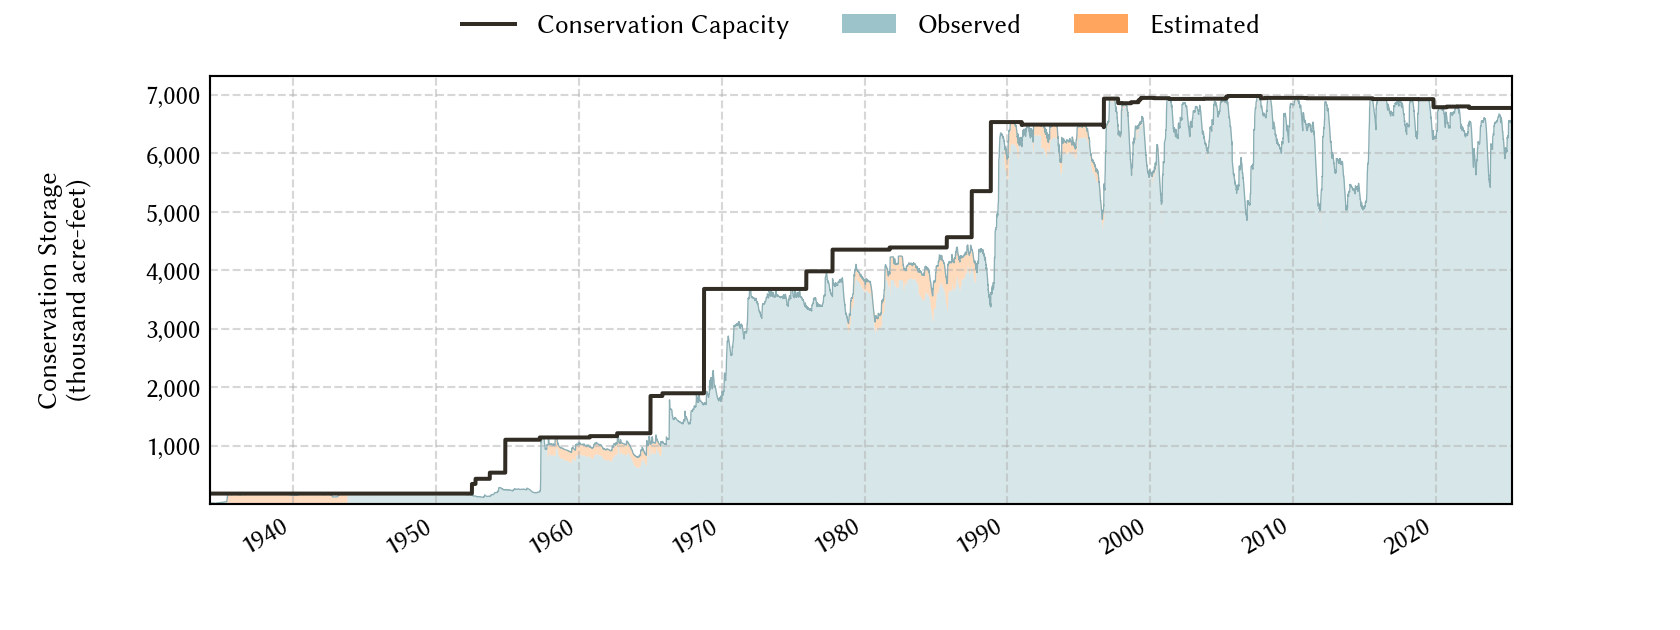
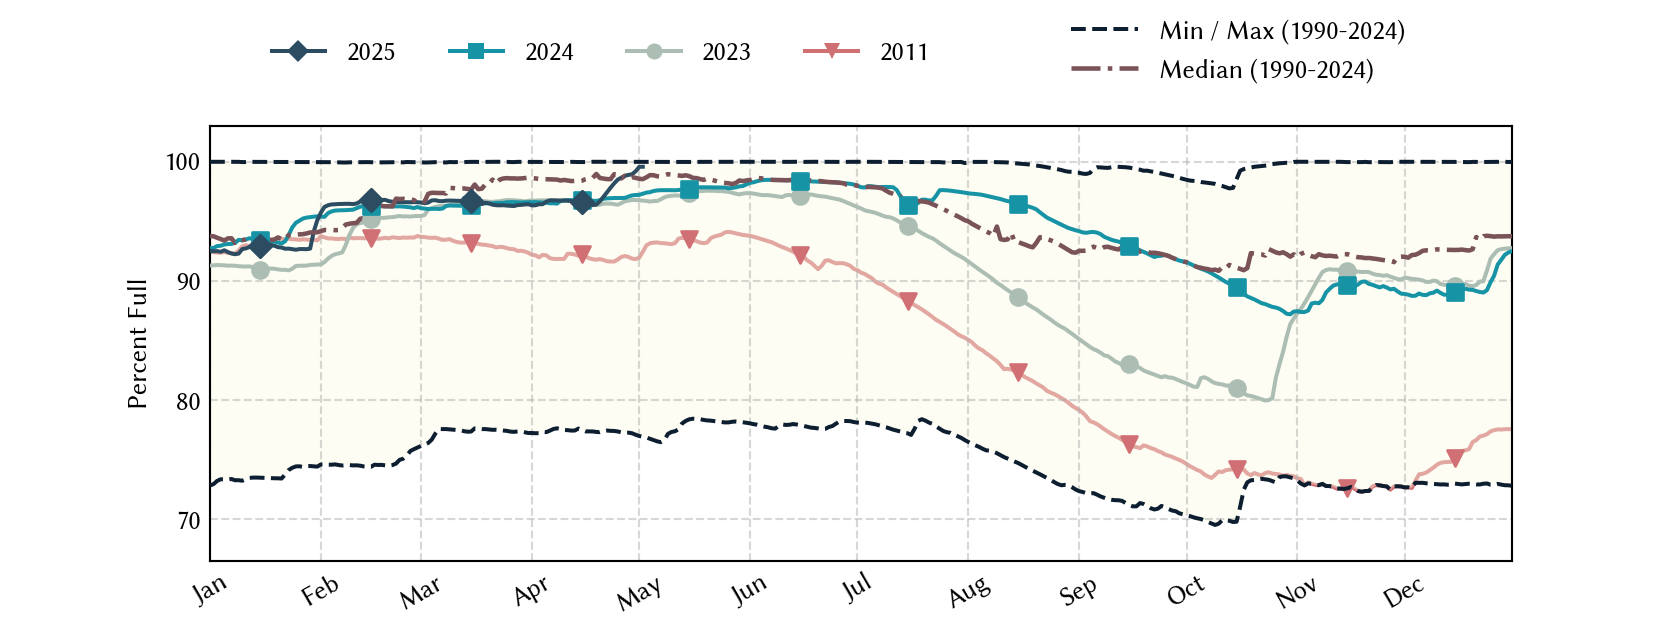
Historical Data
| Date | Percent Full |
Reservoir Storage (acre-ft) |
Conservation Storage (acre-ft) |
Conservation Capacity (acre-ft) |
|
|---|---|---|---|---|---|
| Today | 2026-04-01 | 95.1 | 6,524,194 | 6,441,778 | 6,776,855 |
| Yesterday | 2026-03-31 | 95.1 | 6,525,126 | 6,442,709 | 6,776,855 |
| 2 days ago | 2026-03-30 | 95.1 | 6,529,597 | 6,446,998 | 6,776,855 |
| 1 week ago | 2026-03-25 | 95.3 | 6,549,029 | 6,460,510 | 6,776,855 |
| 1 month ago | 2026-03-01 | 94.5 | 6,489,950 | 6,403,831 | 6,776,855 |
| 3 months ago | 2026-01-01 | 93.6 | 6,423,268 | 6,343,860 | 6,776,855 |
| 6 months ago | 2025-10-01 | 94.6 | 6,487,211 | 6,409,412 | 6,776,855 |
| 1 year ago | 2025-04-01 | 96.3 | 6,643,729 | 6,528,498 | 6,776,855 |
*
Percent Full is based on Conservation Storage and Conservation Capacity and doesn't account for storage in flood pool.
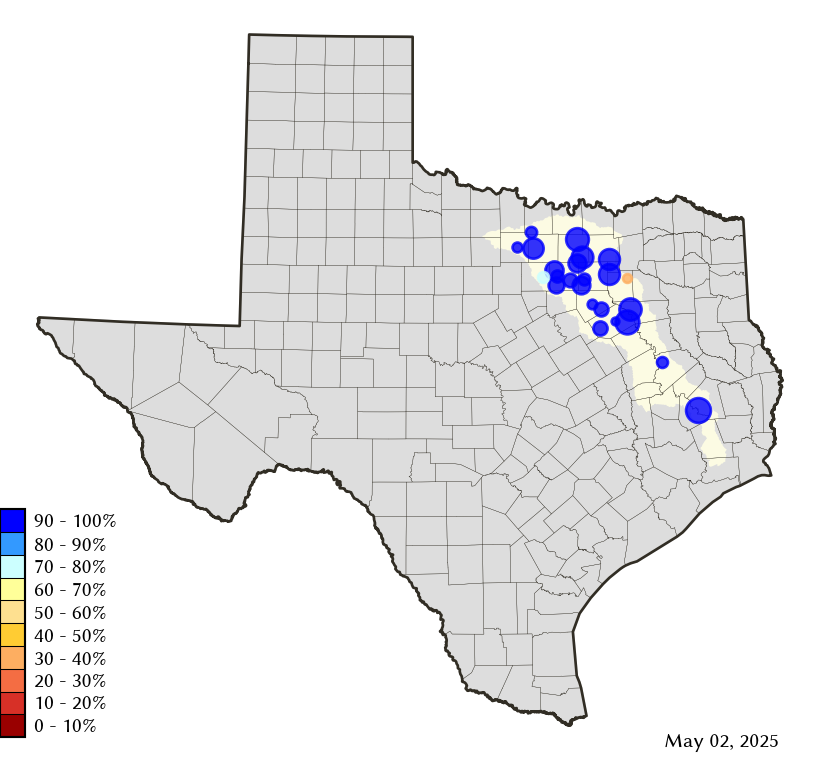
Area Map
Reservoir Storage
| Reservoir | Type | Percent Full |
Water Level (ft) |
Height Above Conservation Pool (ft) |
Reservoir Storage (acre-ft) |
Conservation Storage (acre-ft) |
Conservation Capacity (acre-ft) |
Surface Area (acres) |
|---|---|---|---|---|---|---|---|---|
| Amon G Carter |

|
84.9 | 917.93 | -2.07 | 17,147 | 16,363 | 19,266 | 1,334 |
| Arlington |
|
94.2 | 548.77 | -1.23 | 37,843 | 37,811 | 40,157 | 1,892 |
| Bardwell |

|
100.0 | 421.34 | 0.34 | 45,047 | 43,856 | 43,856 | 3,338 |
| Benbrook |
|
82.5 | 689.67 | -4.33 | 70,700 | 70,700 | 85,648 | 3,239 |
| Bridgeport |
|
85.0 | 831.24 | -4.76 | 316,336 | 316,336 | 372,183 | 11,219 |
| Cedar Creek |
|
84.0 | 318.67 | -3.33 | 541,420 | 541,321 | 644,686 | 29,558 |
| Eagle Mountain |
|
82.5 | 645.36 | -3.74 | 152,683 | 152,683 | 185,087 | 8,150 |
| Grapevine |
|
100.0 | 535.09 | 0.09 | 163,658 | 163,064 | 163,064 | - n.a. - |
| Halbert |
|
75.1 | 365.25 | -2.75 | 4,532 | 4,532 | 6,033 | 514 |
| Houston County |
|
100.0 | 260.07 | 0.07 | 17,756 | 17,113 | 17,113 | - n.a. - |
| Joe Pool |
|
100.0 | 522.17 | 0.17 | 152,140 | 149,629 | 149,629 | 6,738 |
| Lavon |
|
97.9 | 491.59 | -0.41 | 404,182 | 401,341 | 409,757 | 20,436 |
| Lewisville |
|
99.6 | 521.91 | -0.09 | 596,473 | 560,799 | 563,228 | 26,976 |
| Livingston |
|
99.7 | 130.94 | -0.06 | 1,598,847 | 1,598,847 | 1,603,504 | 77,491 |
| Lost Creek |
|
93.3 | 1,007.47 | -2.03 | 11,144 | 11,144 | 11,950 | - n.a. - |
| Mountain Creek |
|
100.0 | 457.82 | 0.82 | 25,121 | 22,850 | 22,850 | 2,950 |
| Navarro Mills |
|
95.1 | 423.98 | -0.52 | 47,408 | 47,407 | 49,827 | 4,600 |
| New Terrell City |
|
26.8 | 494.00 | -10.00 | 2,307 | 2,296 | 8,583 | 378 |
| Ray Hubbard |
|
99.3 | 435.35 | -0.15 | 436,432 | 436,432 | 439,559 | 20,763 |
| Ray Roberts |
|
99.9 | 632.48 | -0.02 | 787,923 | 787,600 | 788,167 | 28,578 |
| Richland-Chambers |
|
92.8 | 313.16 | -1.84 | 1,045,825 | 1,020,042 | 1,099,417 | 42,403 |
| Waxahachie |
|
84.9 | 528.86 | -2.64 | 9,974 | 9,392 | 11,060 | 602 |
| Weatherford |
|
65.9 | 889.87 | -6.13 | 11,745 | 11,745 | 17,812 | 908 |
| Worth |
|
75.7 | 592.21 | -1.79 | 27,551 | 18,475 | 24,419 | 3,213 |