Tyler Area Reservoirs: Monitored Water Supply Reservoirs are 96.4% full on 2026-04-01
Historical Data
| Date | Percent Full |
Reservoir Storage (acre-ft) |
Conservation Storage (acre-ft) |
Conservation Capacity (acre-ft) |
|
|---|---|---|---|---|---|
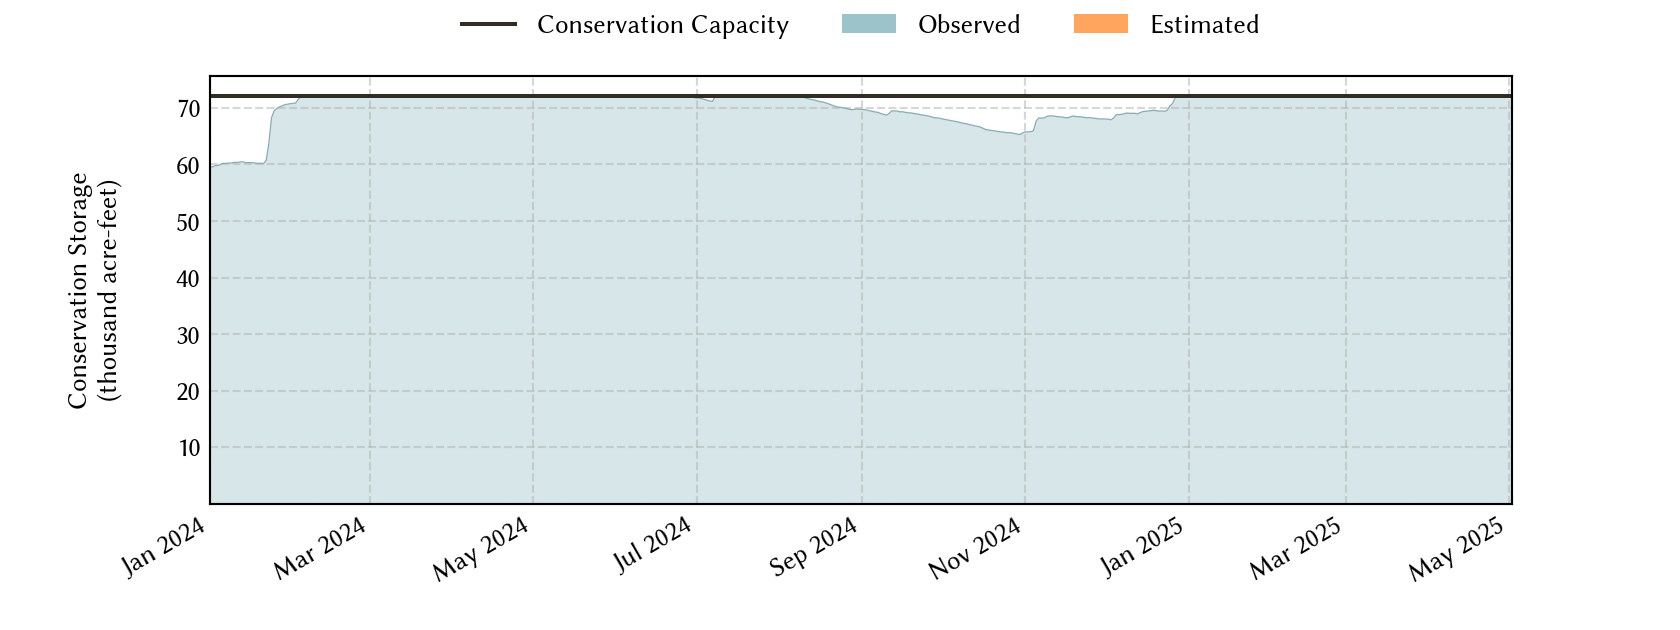
| Today | 2026-04-01 | 96.4 | 74,725 | 69,514 | 72,073 |
| Yesterday | 2026-03-31 | 96.5 | 74,771 | 69,560 | 72,073 |
| 2 days ago | 2026-03-30 | 96.6 | 74,817 | 69,606 | 72,073 |
| 1 week ago | 2026-03-25 | 97.2 | 75,278 | 70,067 | 72,073 |
| 1 month ago | 2026-03-01 | 96.1 | 74,450 | 69,239 | 72,073 |
| 3 months ago | 2026-01-01 | 91.7 | 71,295 | 66,084 | 72,073 |
| 6 months ago | 2025-10-01 | 93.9 | 72,906 | 67,695 | 72,073 |
| 1 year ago | 2025-04-01 | 100.0 | 78,470 | 72,073 | 72,073 |
*
Percent Full is based on Conservation Storage and Conservation Capacity and doesn't account for storage in flood pool.
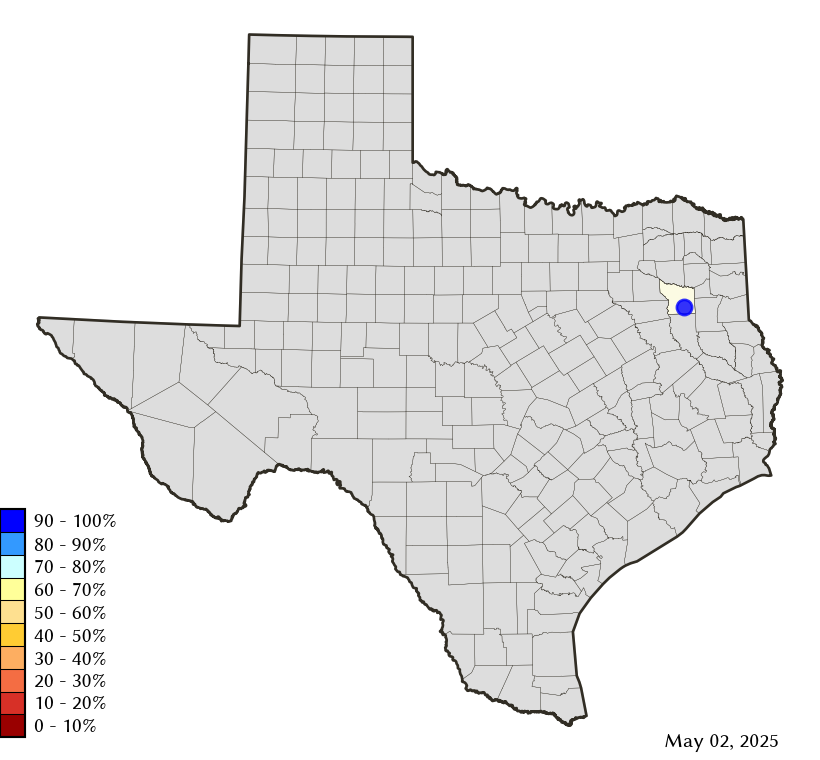
Area Map
Reservoir Storage
| Reservoir | Type | Percent Full |
Water Level (ft) |
Height Above Conservation Pool (ft) |
Reservoir Storage (acre-ft) |
Conservation Storage (acre-ft) |
Conservation Capacity (acre-ft) |
Surface Area (acres) |
|---|---|---|---|---|---|---|---|---|
| Tyler |

|
96.4 | 374.83 | -0.55 | 74,725 | 69,514 | 72,073 | 4,591 |