Reservoir Storage Summary for Climate Divisions on 2026-04-01
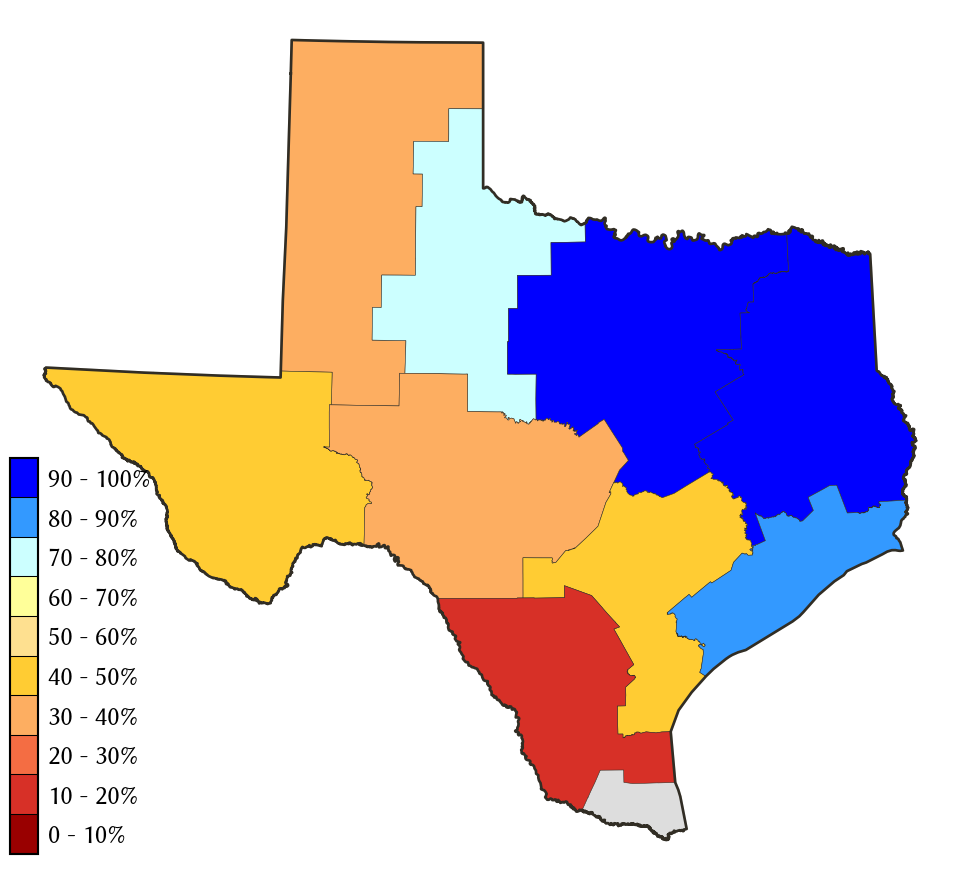
Percent Full
| Today | Yesterday | 2 days ago | 1 week ago | 1 month ago | 3 months ago | 6 months ago | 1 year ago | |
|---|---|---|---|---|---|---|---|---|
| 2026-04-01 | 2026-03-31 | 2026-03-30 | 2026-03-25 | 2026-03-01 | 2026-01-01 | 2025-10-01 | 2025-04-01 | |
| East Texas | 86.0 | 86.0 | 86.1 | 86.3 | 84.7 | 84.4 | 86.9 | 98.8 |
| Edwards Plateau | 44.6 | 44.7 | 44.7 | 44.9 | 45.4 | 47.3 | 47.9 | 33.6 |
| High Plains | 38.1 | 38.2 | 38.2 | 38.3 | 38.7 | 39.2 | 40.4 | 33.6 |
| Low Rolling Plains | 61.3 | 61.5 | 61.7 | 63.0 | 64.1 | 65.3 | 68.9 | 68.8 |
| North Central | 91.9 | 91.9 | 92.0 | 92.2 | 91.9 | 91.4 | 93.6 | 92.5 |
| South | 14.9 | 15.0 | 15.1 | 15.4 | 16.2 | 14.7 | 15.1 | 16.7 |
| South Central | 61.9 | 62.1 | 62.2 | 62.9 | 64.0 | 66.0 | 71.4 | 42.8 |
| Trans Pecos | 57.3 | 57.3 | 57.2 | 57.3 | 56.9 | 52.9 | 50.6 | 40.1 |
| Upper Coast | 73.1 | 73.2 | 73.3 | 74.1 | 76.2 | 79.6 | 89.1 | 88.8 |
*
Percent Full is based on Conservation Storage and Conservation Capacity.
Recent Conditions
| Percent Full |
Reservoir Storage (acre-ft) |
Conservation Storage (acre-ft) |
Conservation Capacity (acre-ft) |
|
|---|---|---|---|---|
| East Texas | 86.0 | 10,696,133 | 8,505,429 | 9,887,970 |
| Edwards Plateau | 44.6 | 1,990,778 | 1,901,789 | 4,261,647 |
| High Plains | 38.1 | 282,237 | 243,823 | 639,362 |
| Low Rolling Plains | 61.3 | 557,067 | 554,523 | 903,870 |
| North Central | 91.9 | 11,455,932 | 10,093,377 | 10,983,823 |
| South | 14.9 | 420,026 | 370,677 | 2,481,249 |
| South Central | 61.9 | 1,217,652 | 1,199,940 | 1,936,953 |
| Trans Pecos | 57.3 | 83,121 | 83,121 | 145,165 |
| Upper Coast | 73.1 | 222,055 | 213,041 | 291,293 |
**
The Lower Valley climate division has no contributing Reservoirs present.